Checking NWS alerts, earthquakes, fires, air quality, and avalanche conditions
⚠ NWS Weather Alerts
✓
No Active Weather Alerts
Checking NWS...
🌬 Air Quality Index
Loading AQI data...
🔥 Active Fires Nearby
Scanning for active fires...
🌍 Earthquake Activity — 200km Radius
Loading USGS data...
🏔 Avalanche Conditions
Checking avalanche advisory...
Data Sources: NWS alerts via api.weather.gov · Air quality via Open-Meteo · Fire data via NASA FIRMS · Earthquakes via USGS · Avalanche data via avalanche.org / Sierra Avalanche Center. All data is free, public, and updated automatically.
⛈ Storm Watch — Flood Watch in effect until 11 PM tonight
Well, it finally showed up. The moisture that spent all month circling us made its move overnight — it's 63° at 3 AM with humidity pinned at 89%, the air outside feels imported from another state, and Reno has a Flood Watch posted for the Truckee area through 11 tonight.
Here's the shape of today: storms fire after 11 AM and turn likely by early afternoon. Sixty percent — the biggest precip number this page has printed since spring. Monsoon cells barely move, so whatever falls lands in one spot, hard, which is why the watch says flood and not just rain. Anything that doesn't drain is where today's problem lives: low corners of a site, open trenches, fresh spoil. If you've got open excavation, this morning is for buttoning up, not digging deeper.
The flip side: it's over almost before it starts. The watch dies at 11 tonight, Wednesday comes back sunny at 82, and the rest of the week runs dry — 84 Thursday, 85 Friday, 83 Saturday, lows back in the upper 40s. By Thursday the only evidence will be the mud.
Further out, both models sketch a slow climb into next week, a couple of runs poking 90 around next Tuesday and Wednesday. That would be the hottest air of the summer if it verifies. At seven days out I'm flagging it, not scheduling around it.
Fire weather is the strange part of a day like this. The air is wet for once, so today's lightning comes with rain attached — better than the dry kind, but a strike is a strike, and the forest spent six rainless weeks getting ready for one. Watch for smoke Wednesday and Thursday, after the cells clear and anything holding heat gets its chance. Confidence, scored like course inspection day: today's storm risk I'd run at full speed — the watch is posted and the radar will do the talking. The sunny stretch Wednesday through Saturday, same. Next week's heat gets one slow inspection run before I commit to a line. Next note around July 24.
📅 16-Day Outlook
🌀 Tracked Systems
🛰 Satellite — Storm Positions
--:--0/0
ESRI World Imagery · Interactive satellite map
🔮
Extended Outlook — Days 17-30
Trend-level signals blending model momentum with climatology
Lower confidence — trend signals only. These improve as dates approach.
CONFIDENCE DECAY
Loading extended outlook...
🌡 Extended Temperature Signal
Projected range with confidence bands — uncertainty grows with time
💧 Extended Precipitation Signal
Weekly precipitation probability — color-coded by risk threshold
📱 Add to Mobile App ▼
You're viewing: FORECAST — the full platform with all 8 tabs.
iPhone: Open in Safari → Tap ⬆️ Share → Scroll down → Add to Home Screen → Tap Add
Android: Tap ⋮ menu → Install App or Add to Home Screen → Tap Install
🌎 Live & Forecast Maps (Windy)
📡 NOAA Radar — Reno CWA (KRGX)
🔮 Future Radar — Predicted Precipitation
Hourly precipitation forecast for the next 5 hours · Open-Meteo Weather Model
NOW
Loading...0/0
LightModerateHeavyExtremeSnow
ESRI World Imagery · Open-Meteo Forecast
🛰 NOAA Satellite (GOES-18 West)
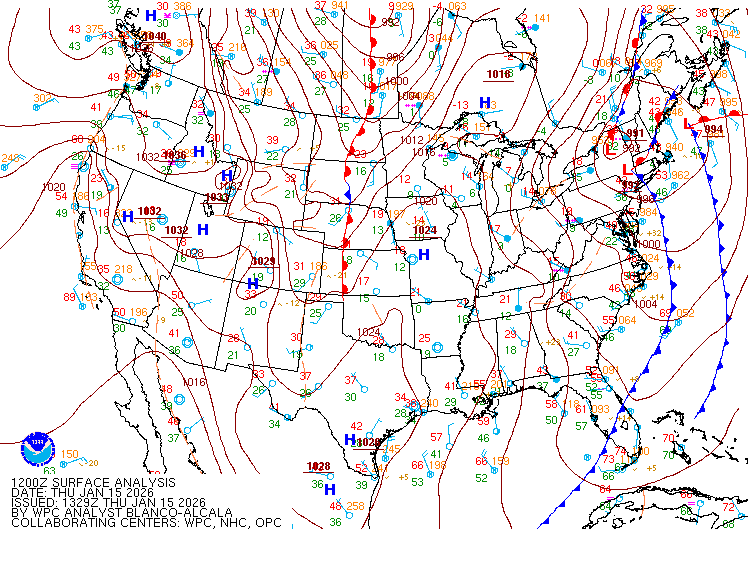
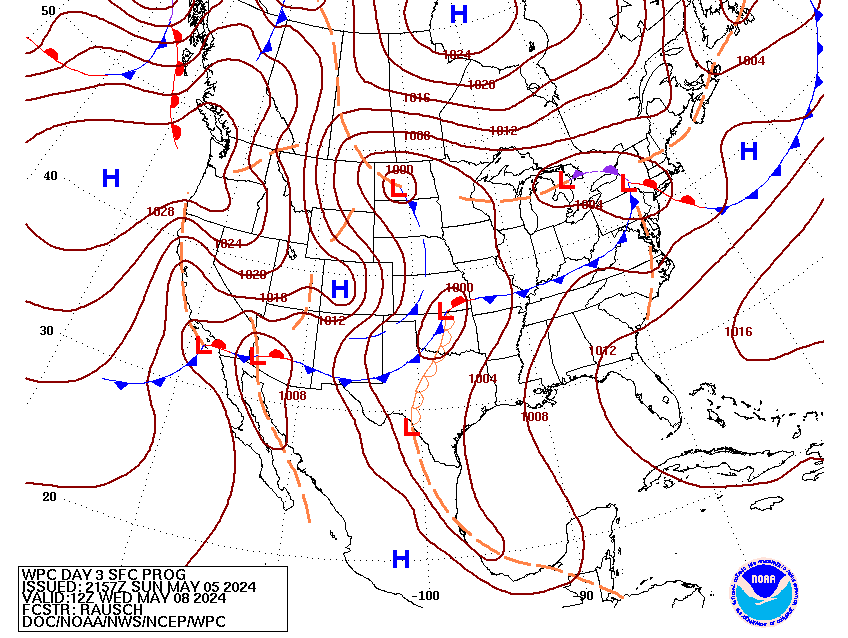
📈 NOAA Analysis Charts & QPF
Surface Analysis
500mb Analysis
Jet Stream (300mb)
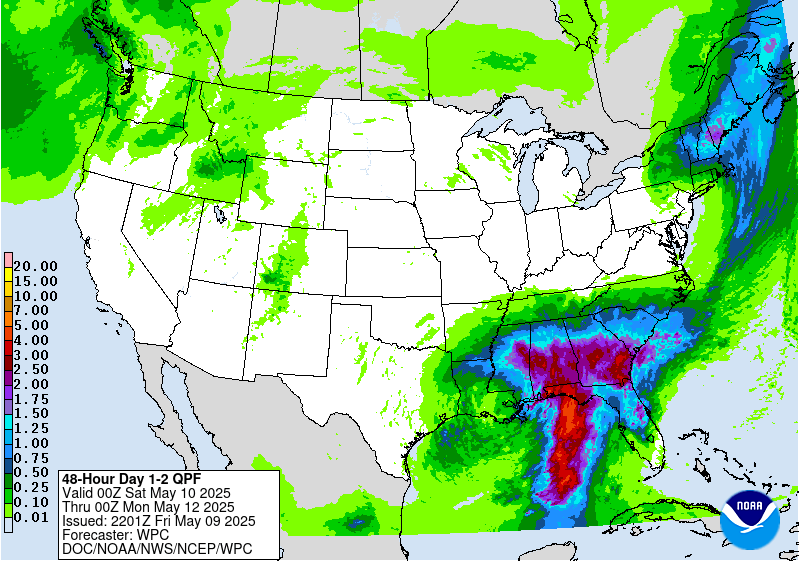
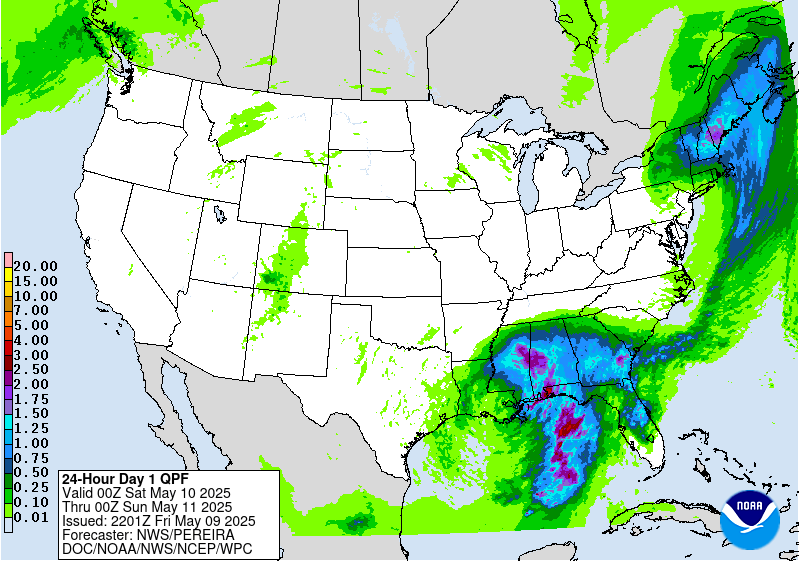
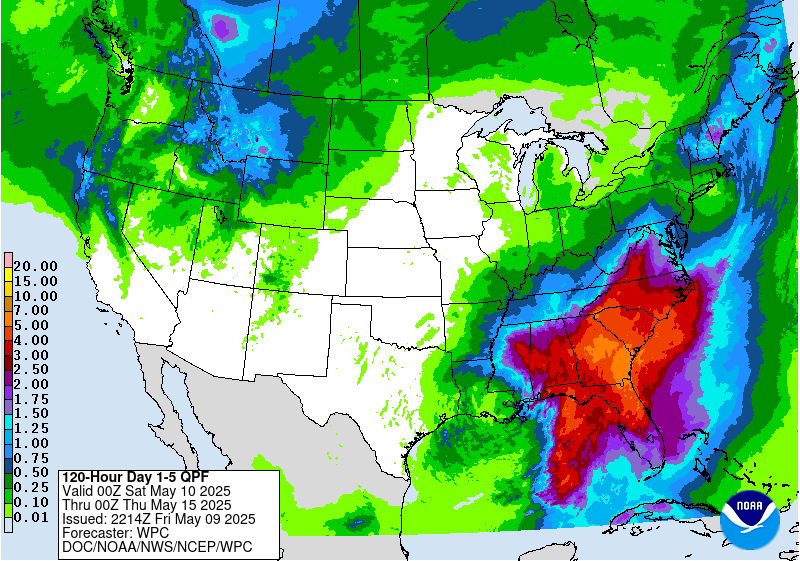
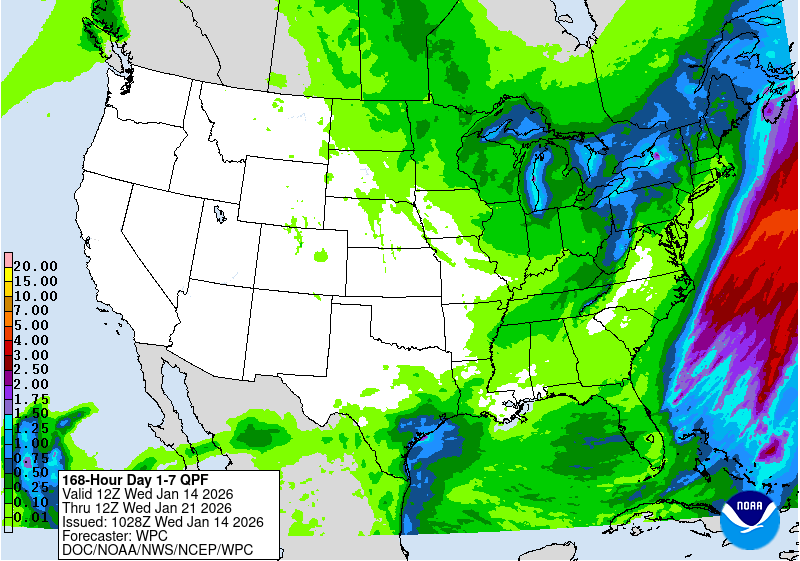
Day 1 QPF
Day 1-3 QPF
5-Day QPF
7-Day QPF
⚡ SPC Convective Outlook
Day 1 Outlook
Day 2 Outlook
Day 3 Outlook
📅 CPC Climate Outlook Products
🌡 Week 1 Outlook (6-10 Day)▼
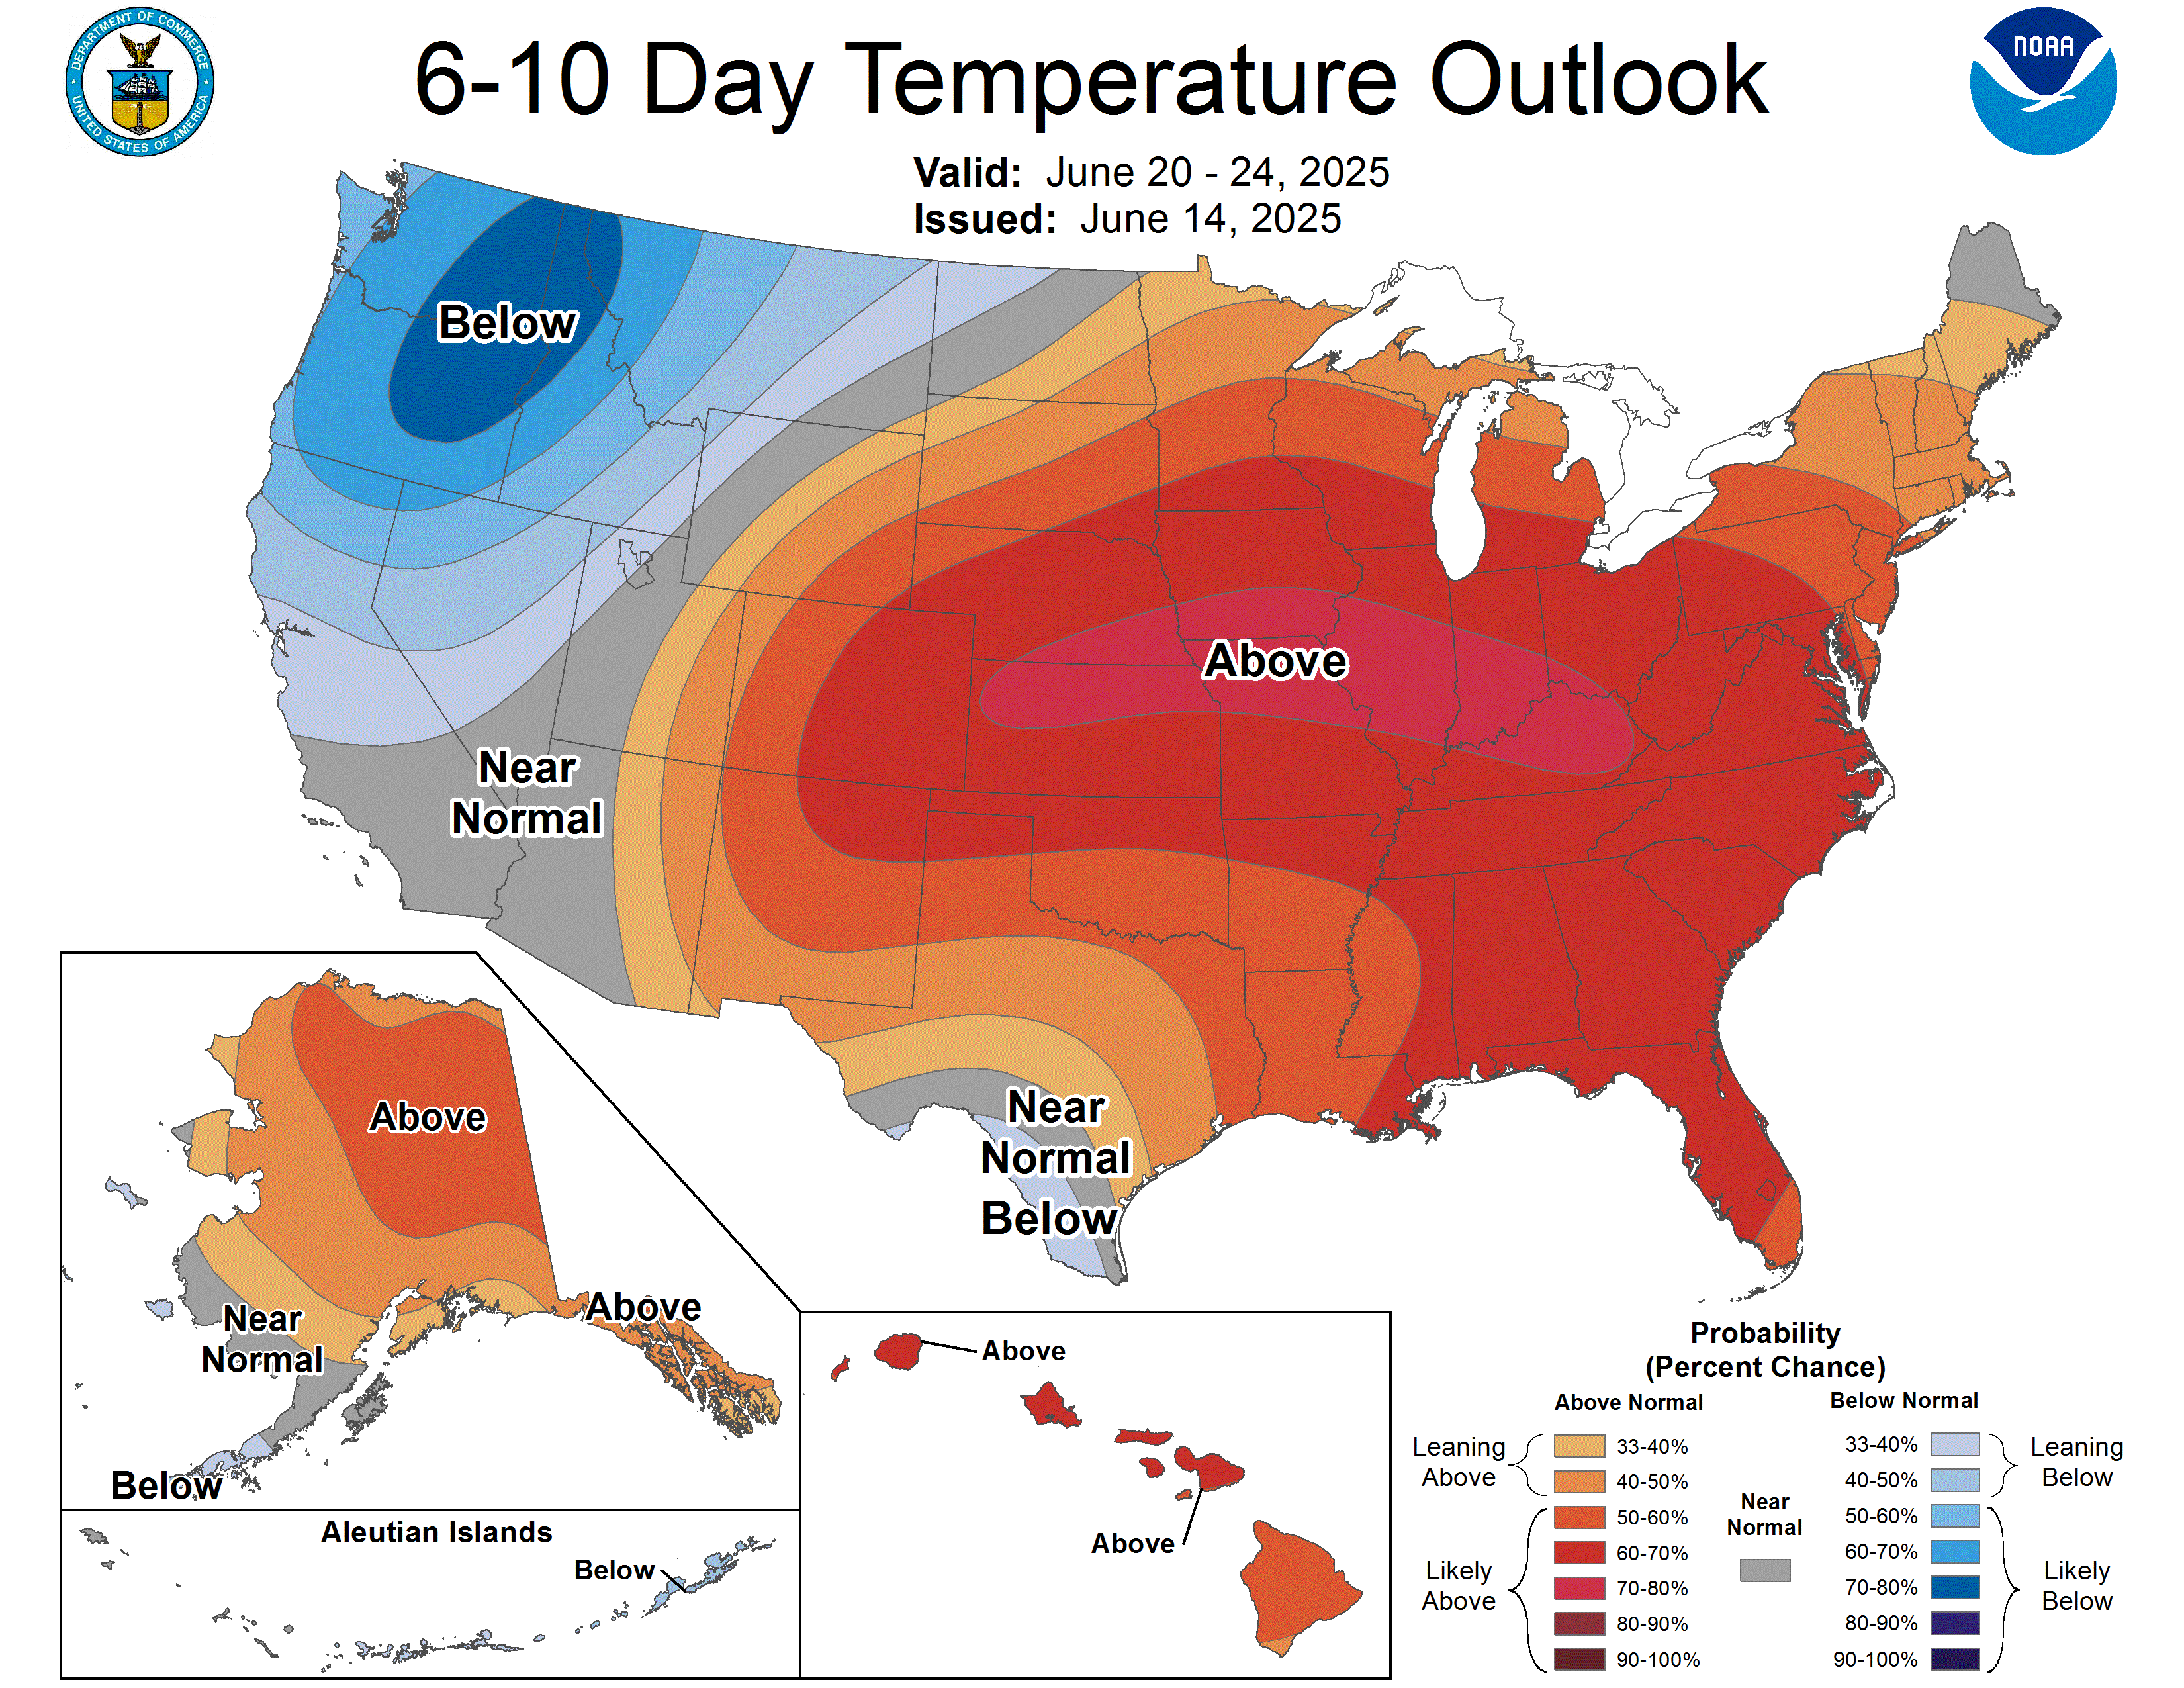
6-10 Day Temperature
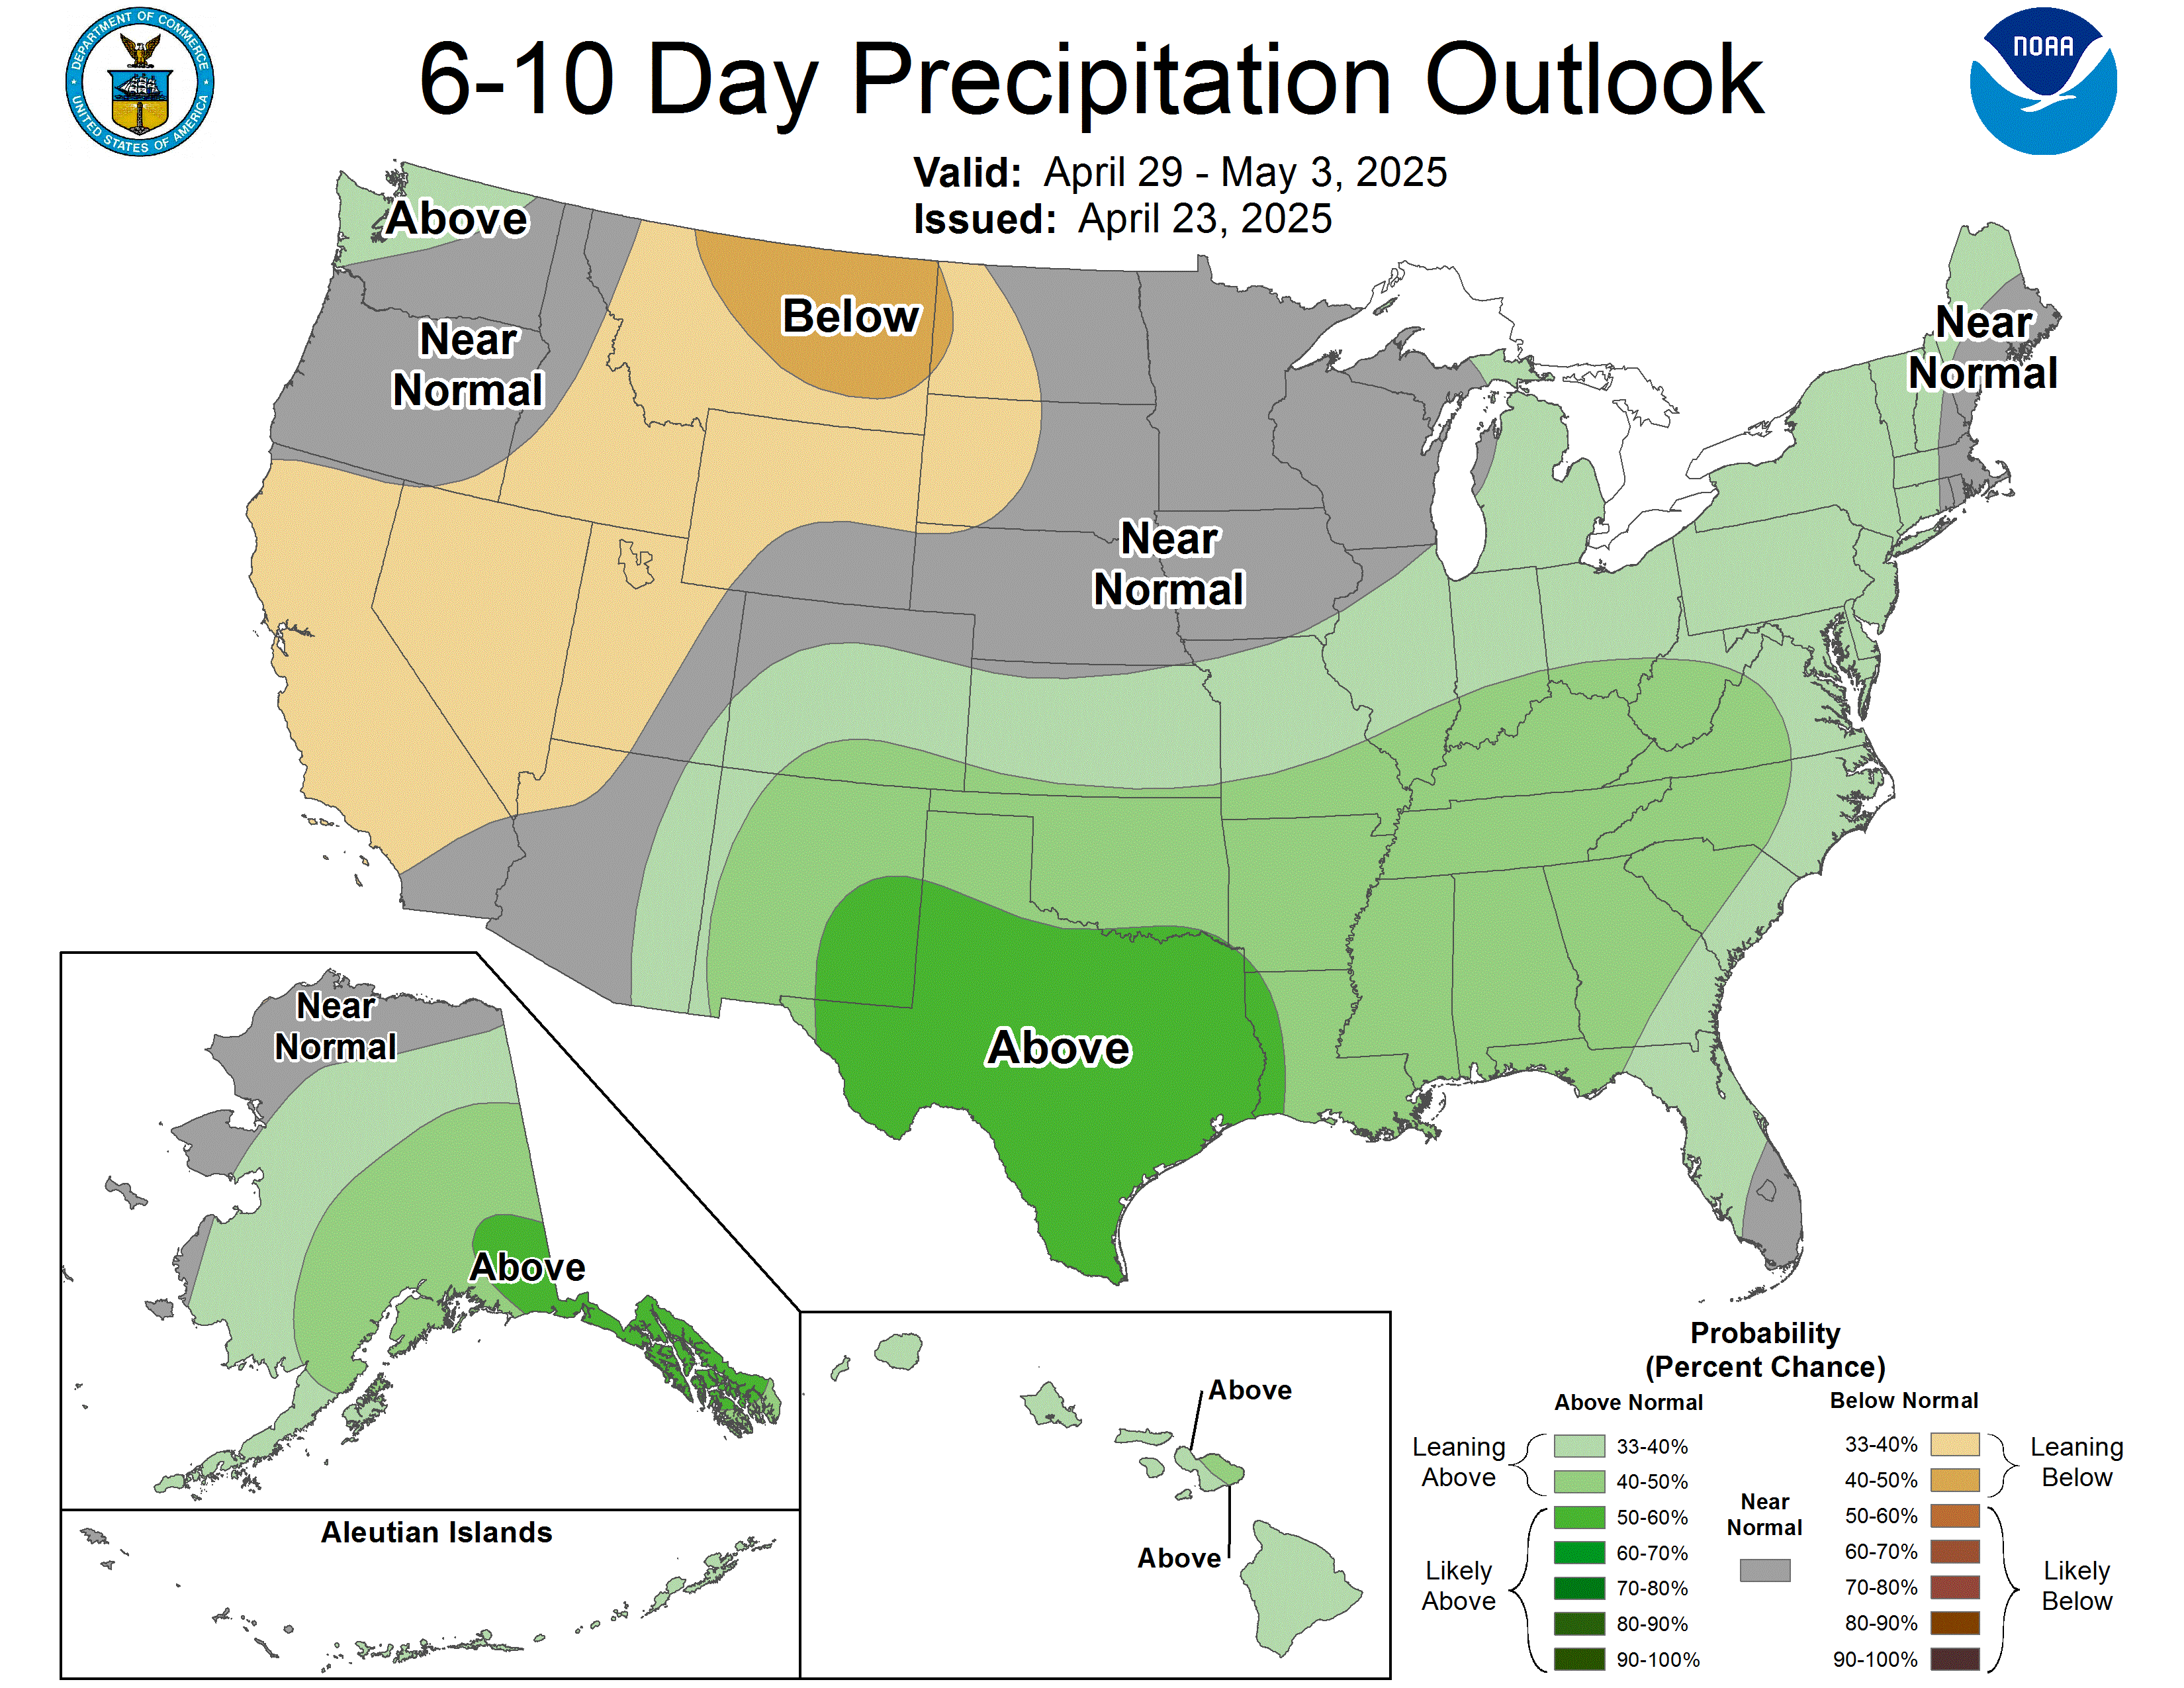
6-10 Day Precipitation
🌡 Week 2 Outlook (8-14 Day)▼
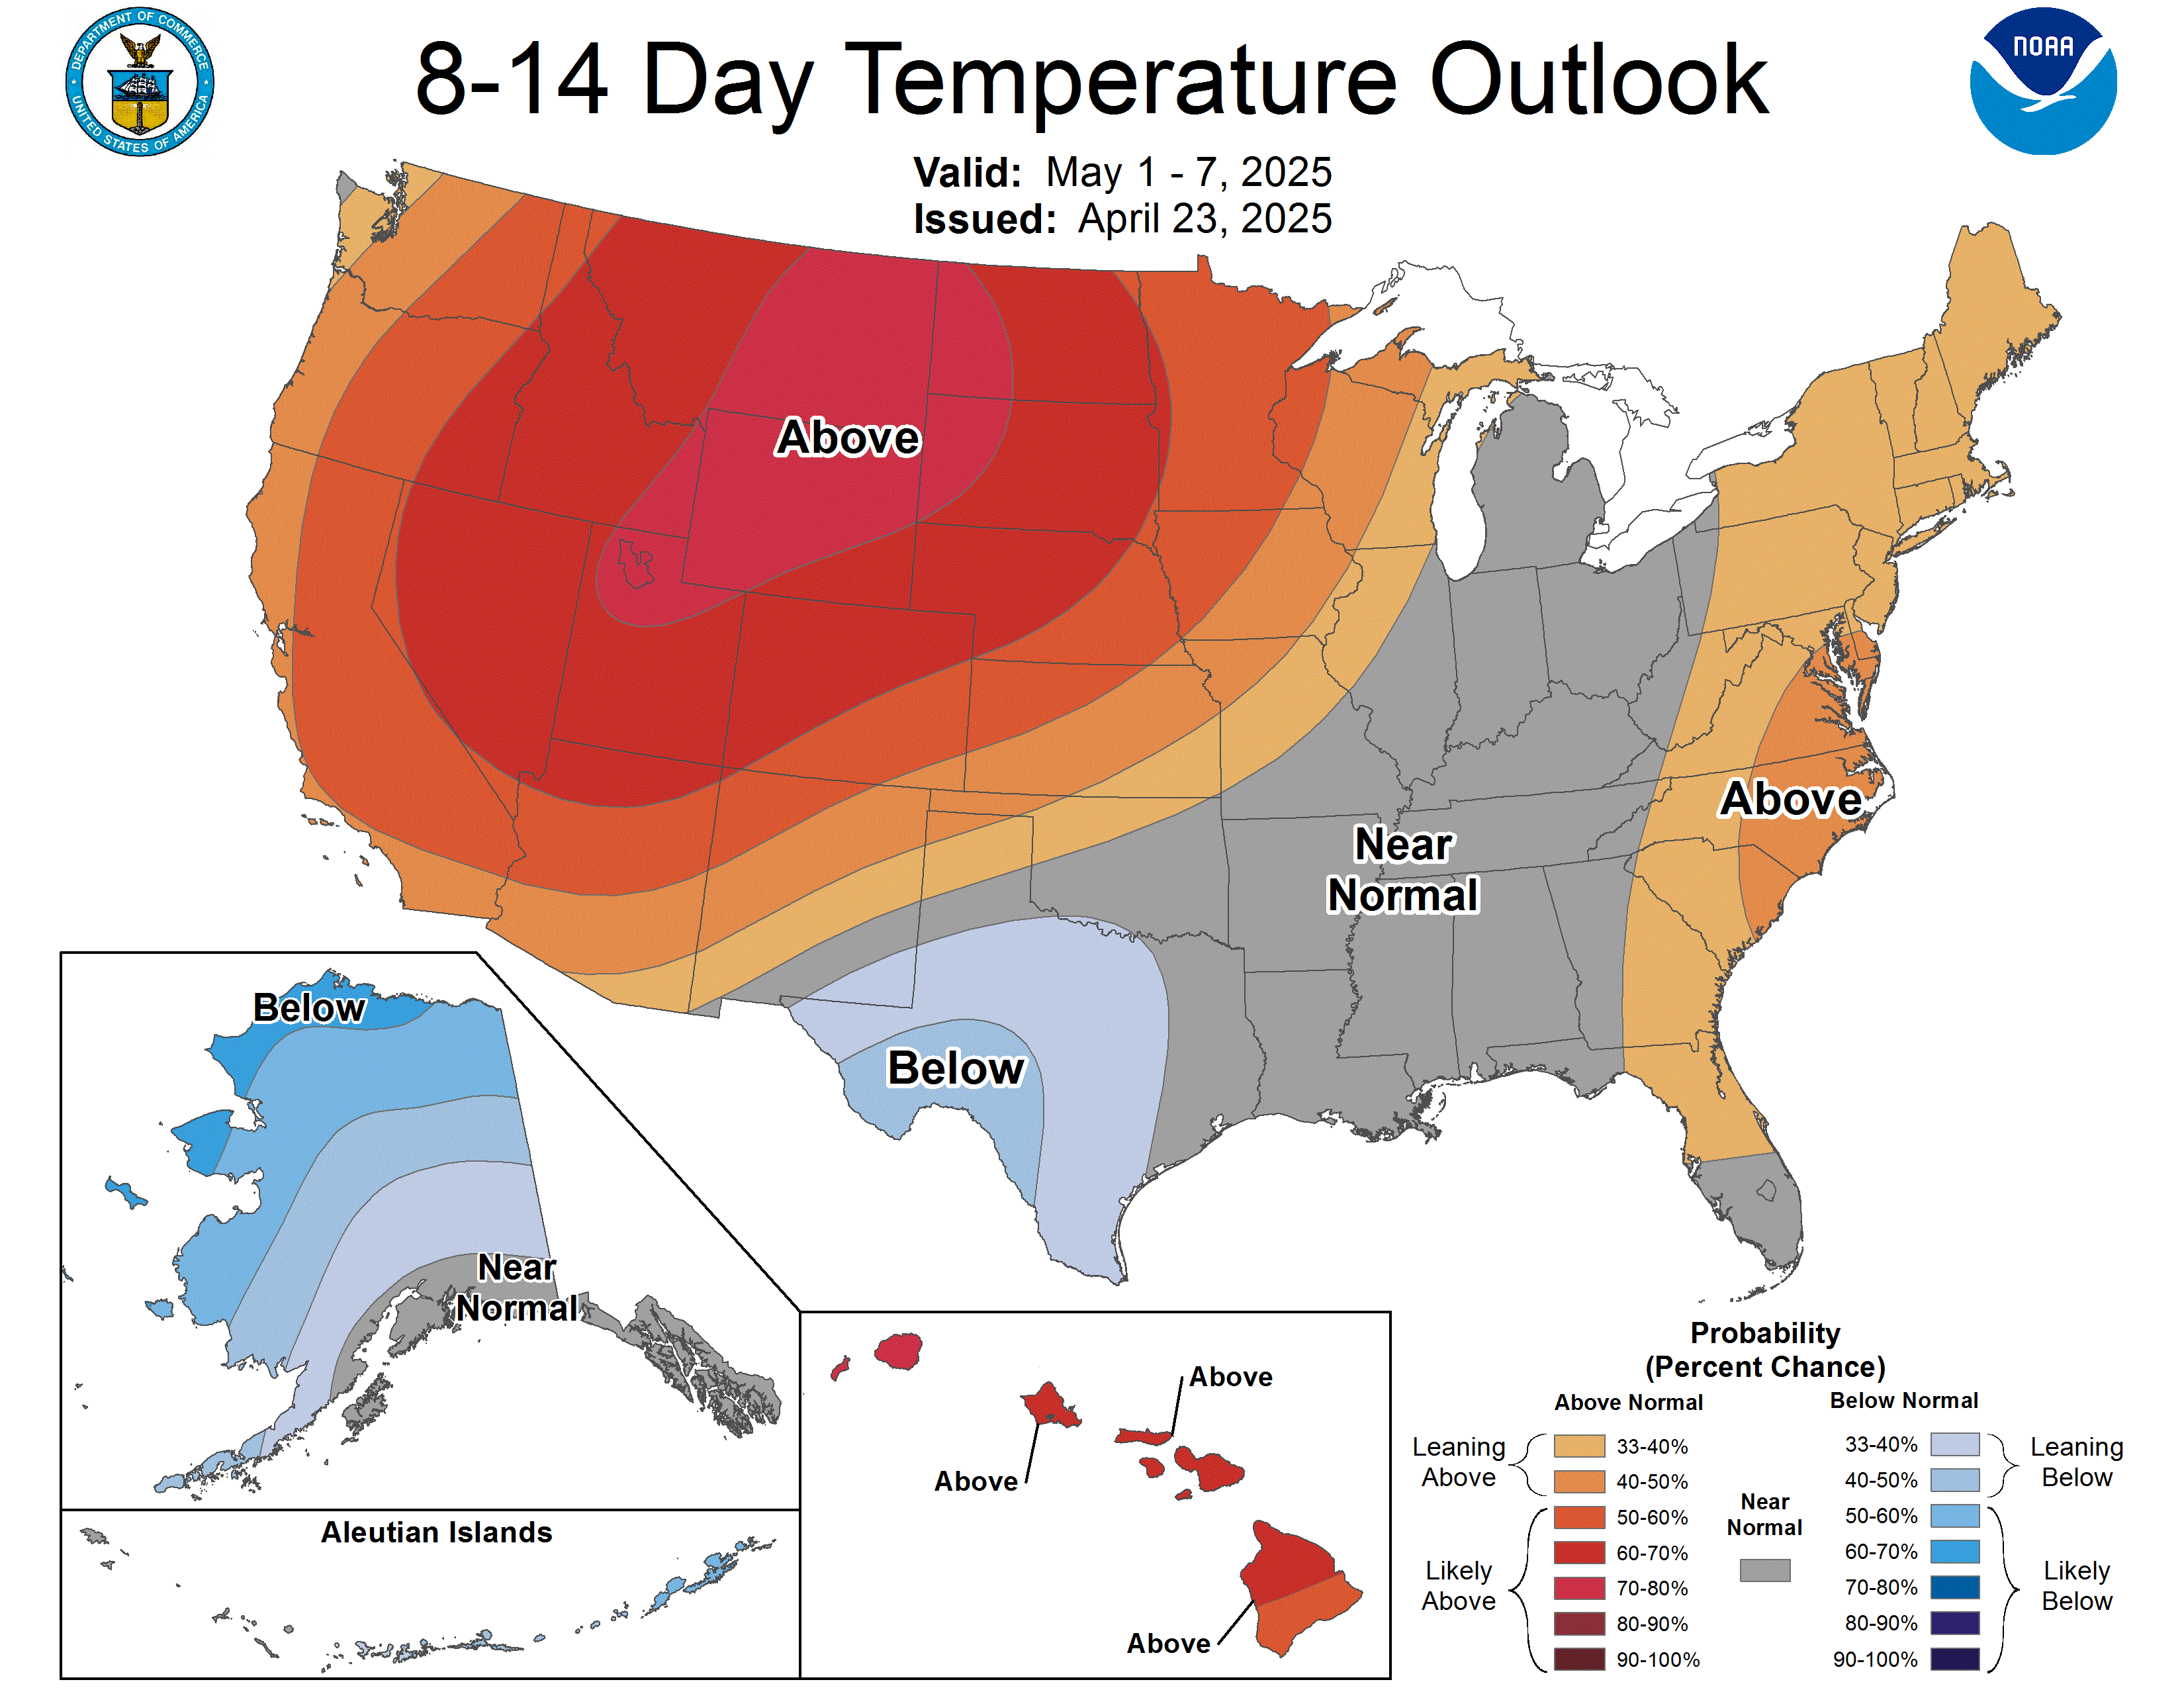
8-14 Day Temperature
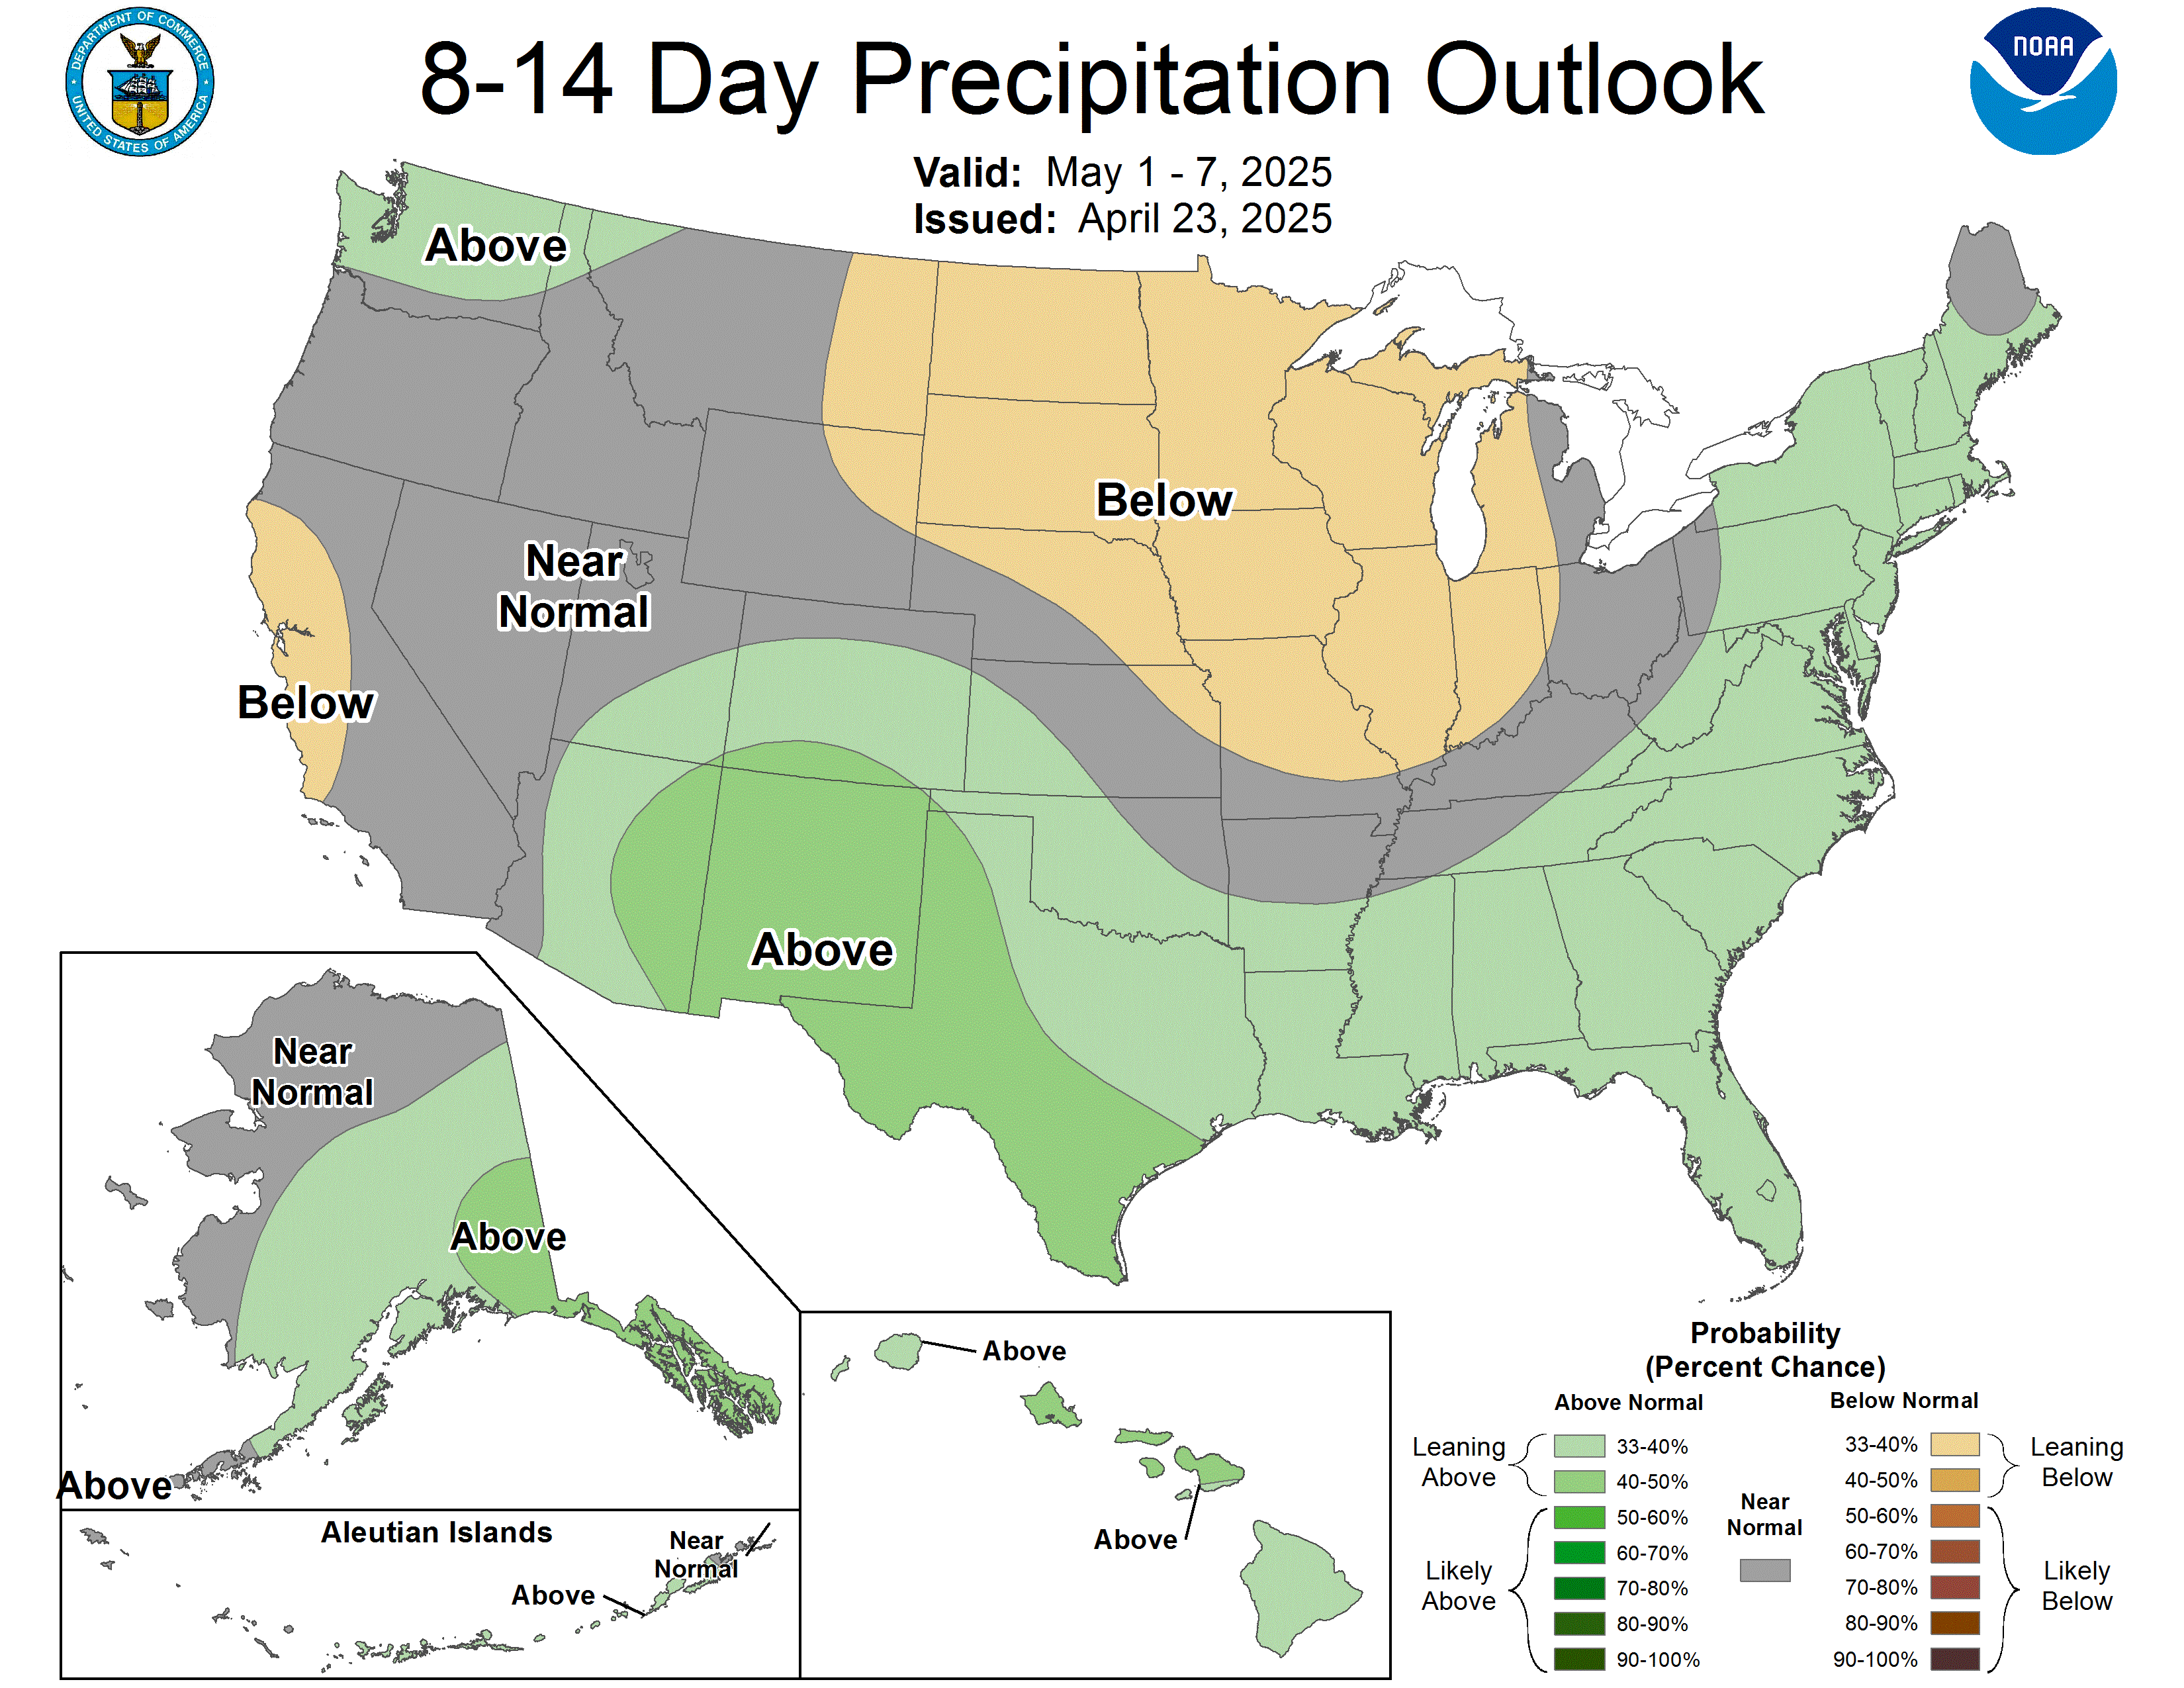
8-14 Day Precipitation
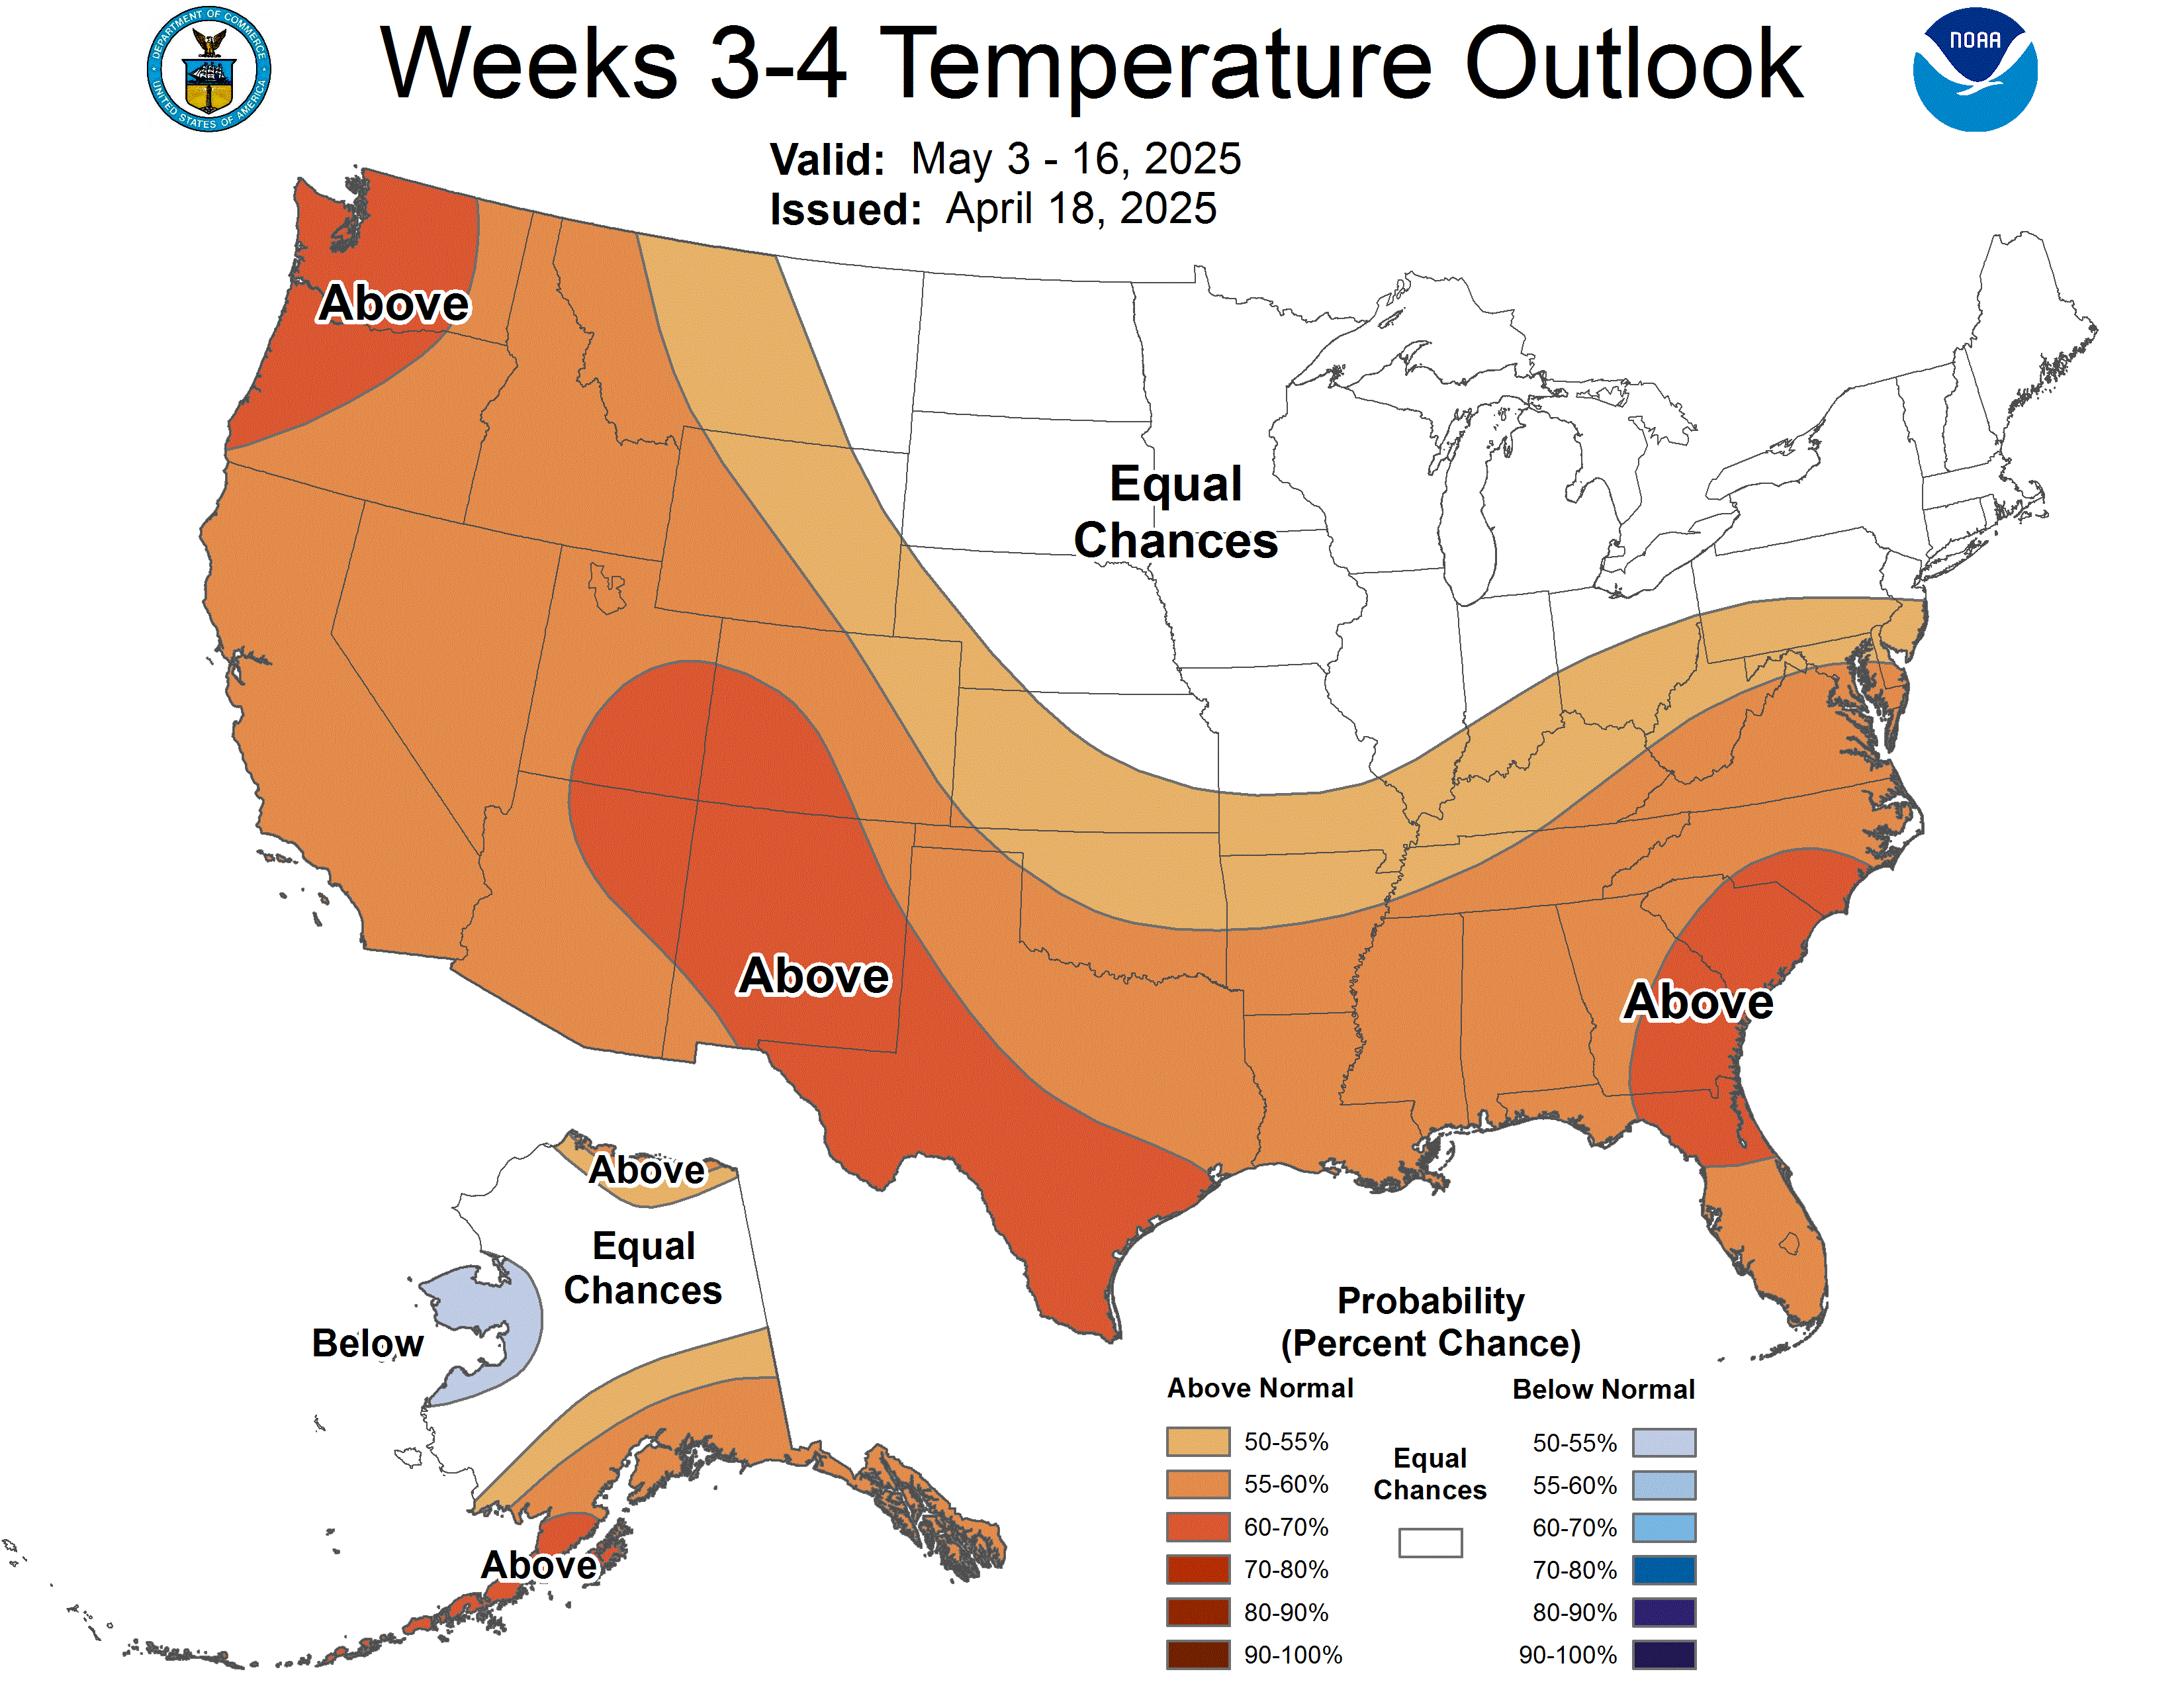
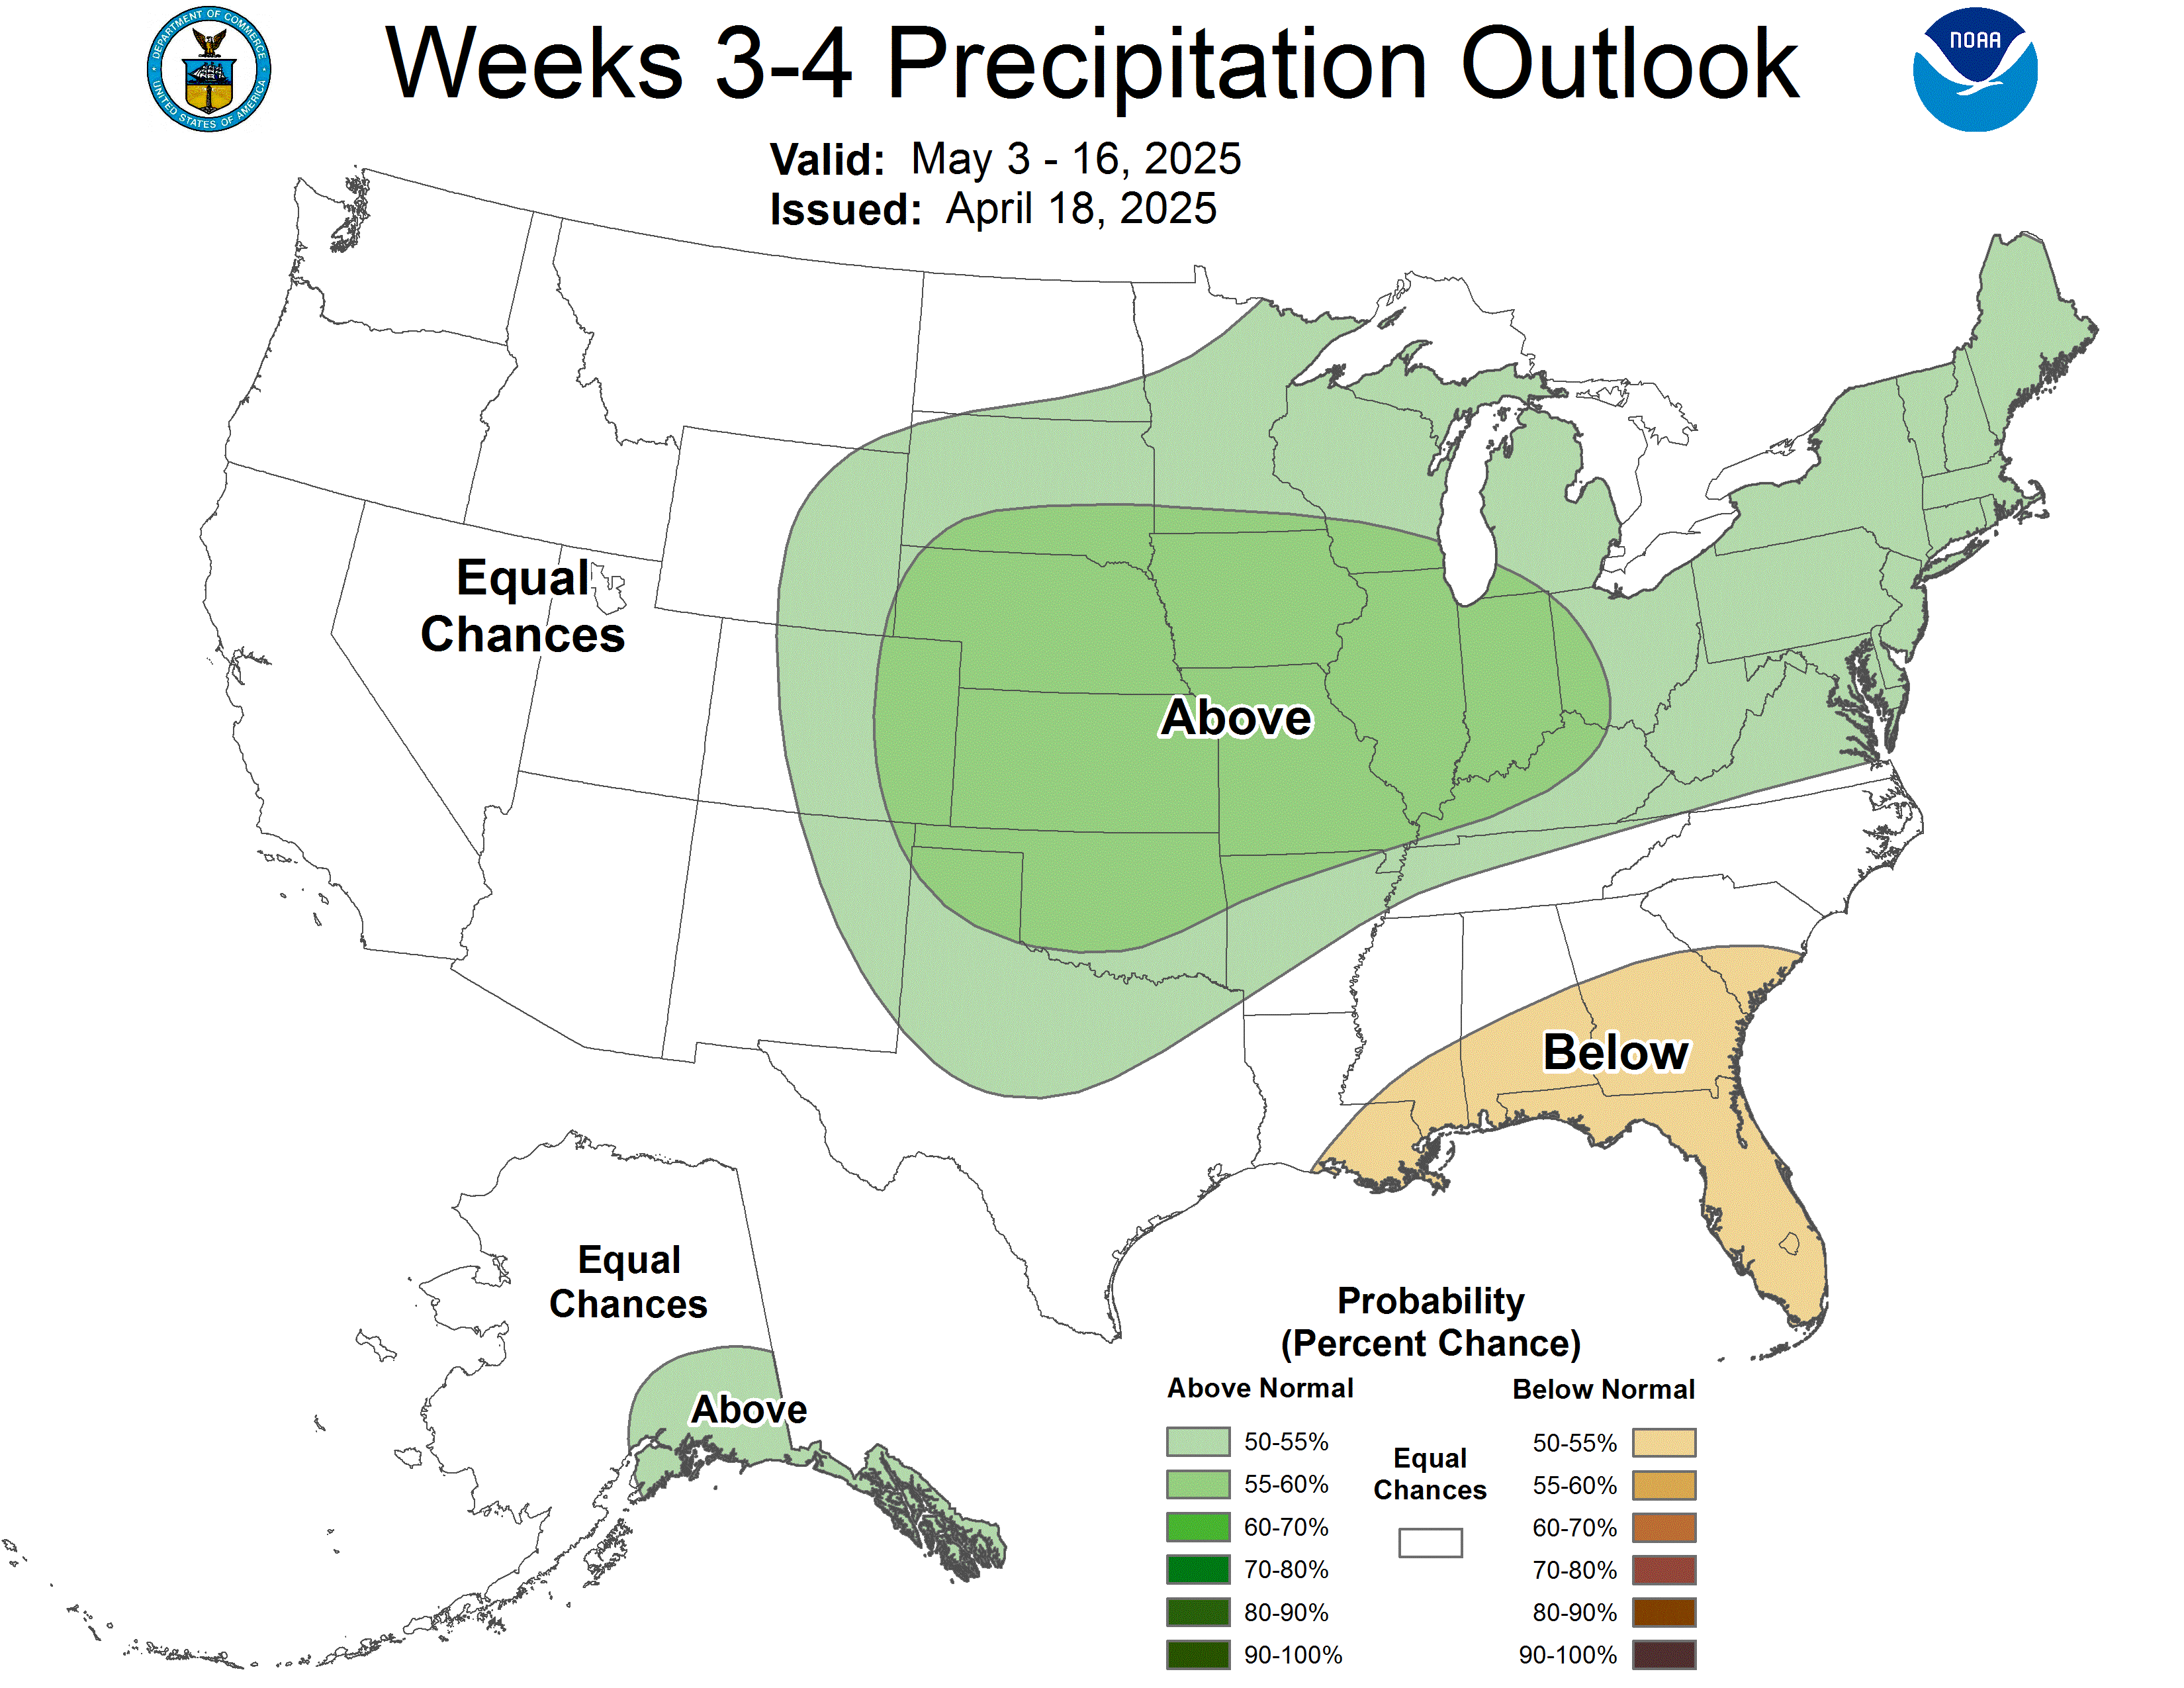
🌧 Week 3-4 Outlook▼
Week 3-4 Temperature
Week 3-4 Precipitation
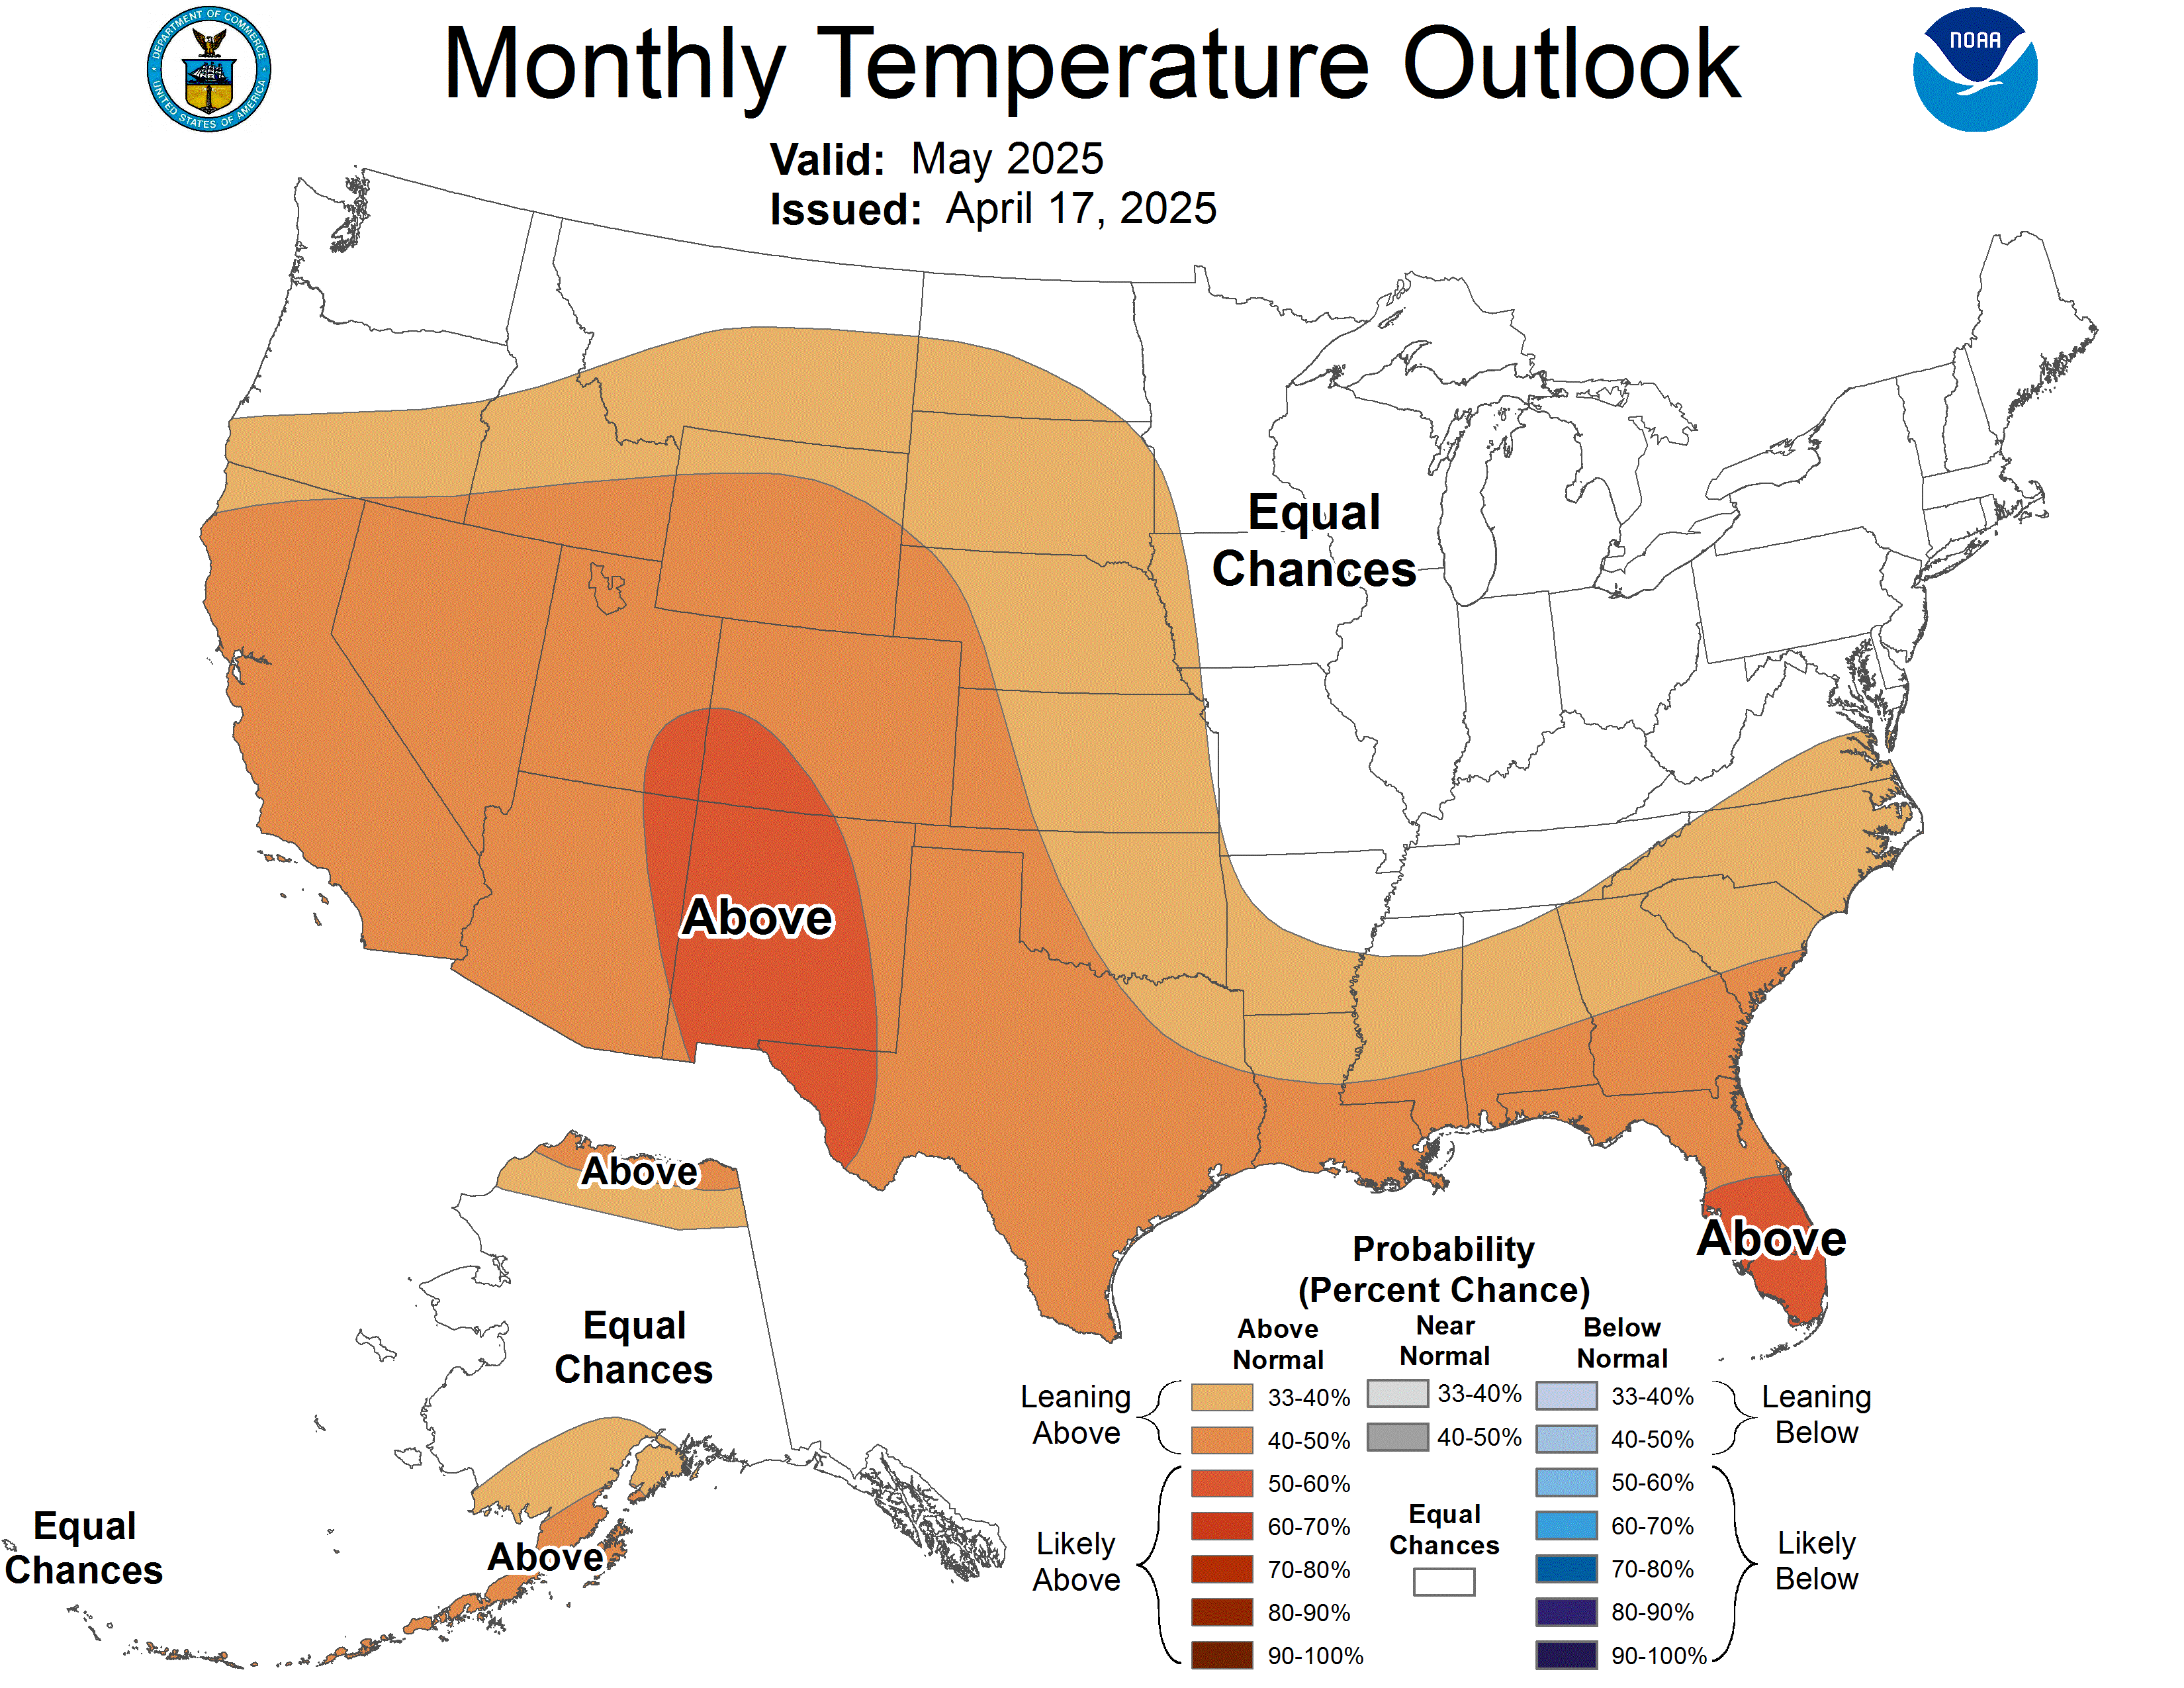
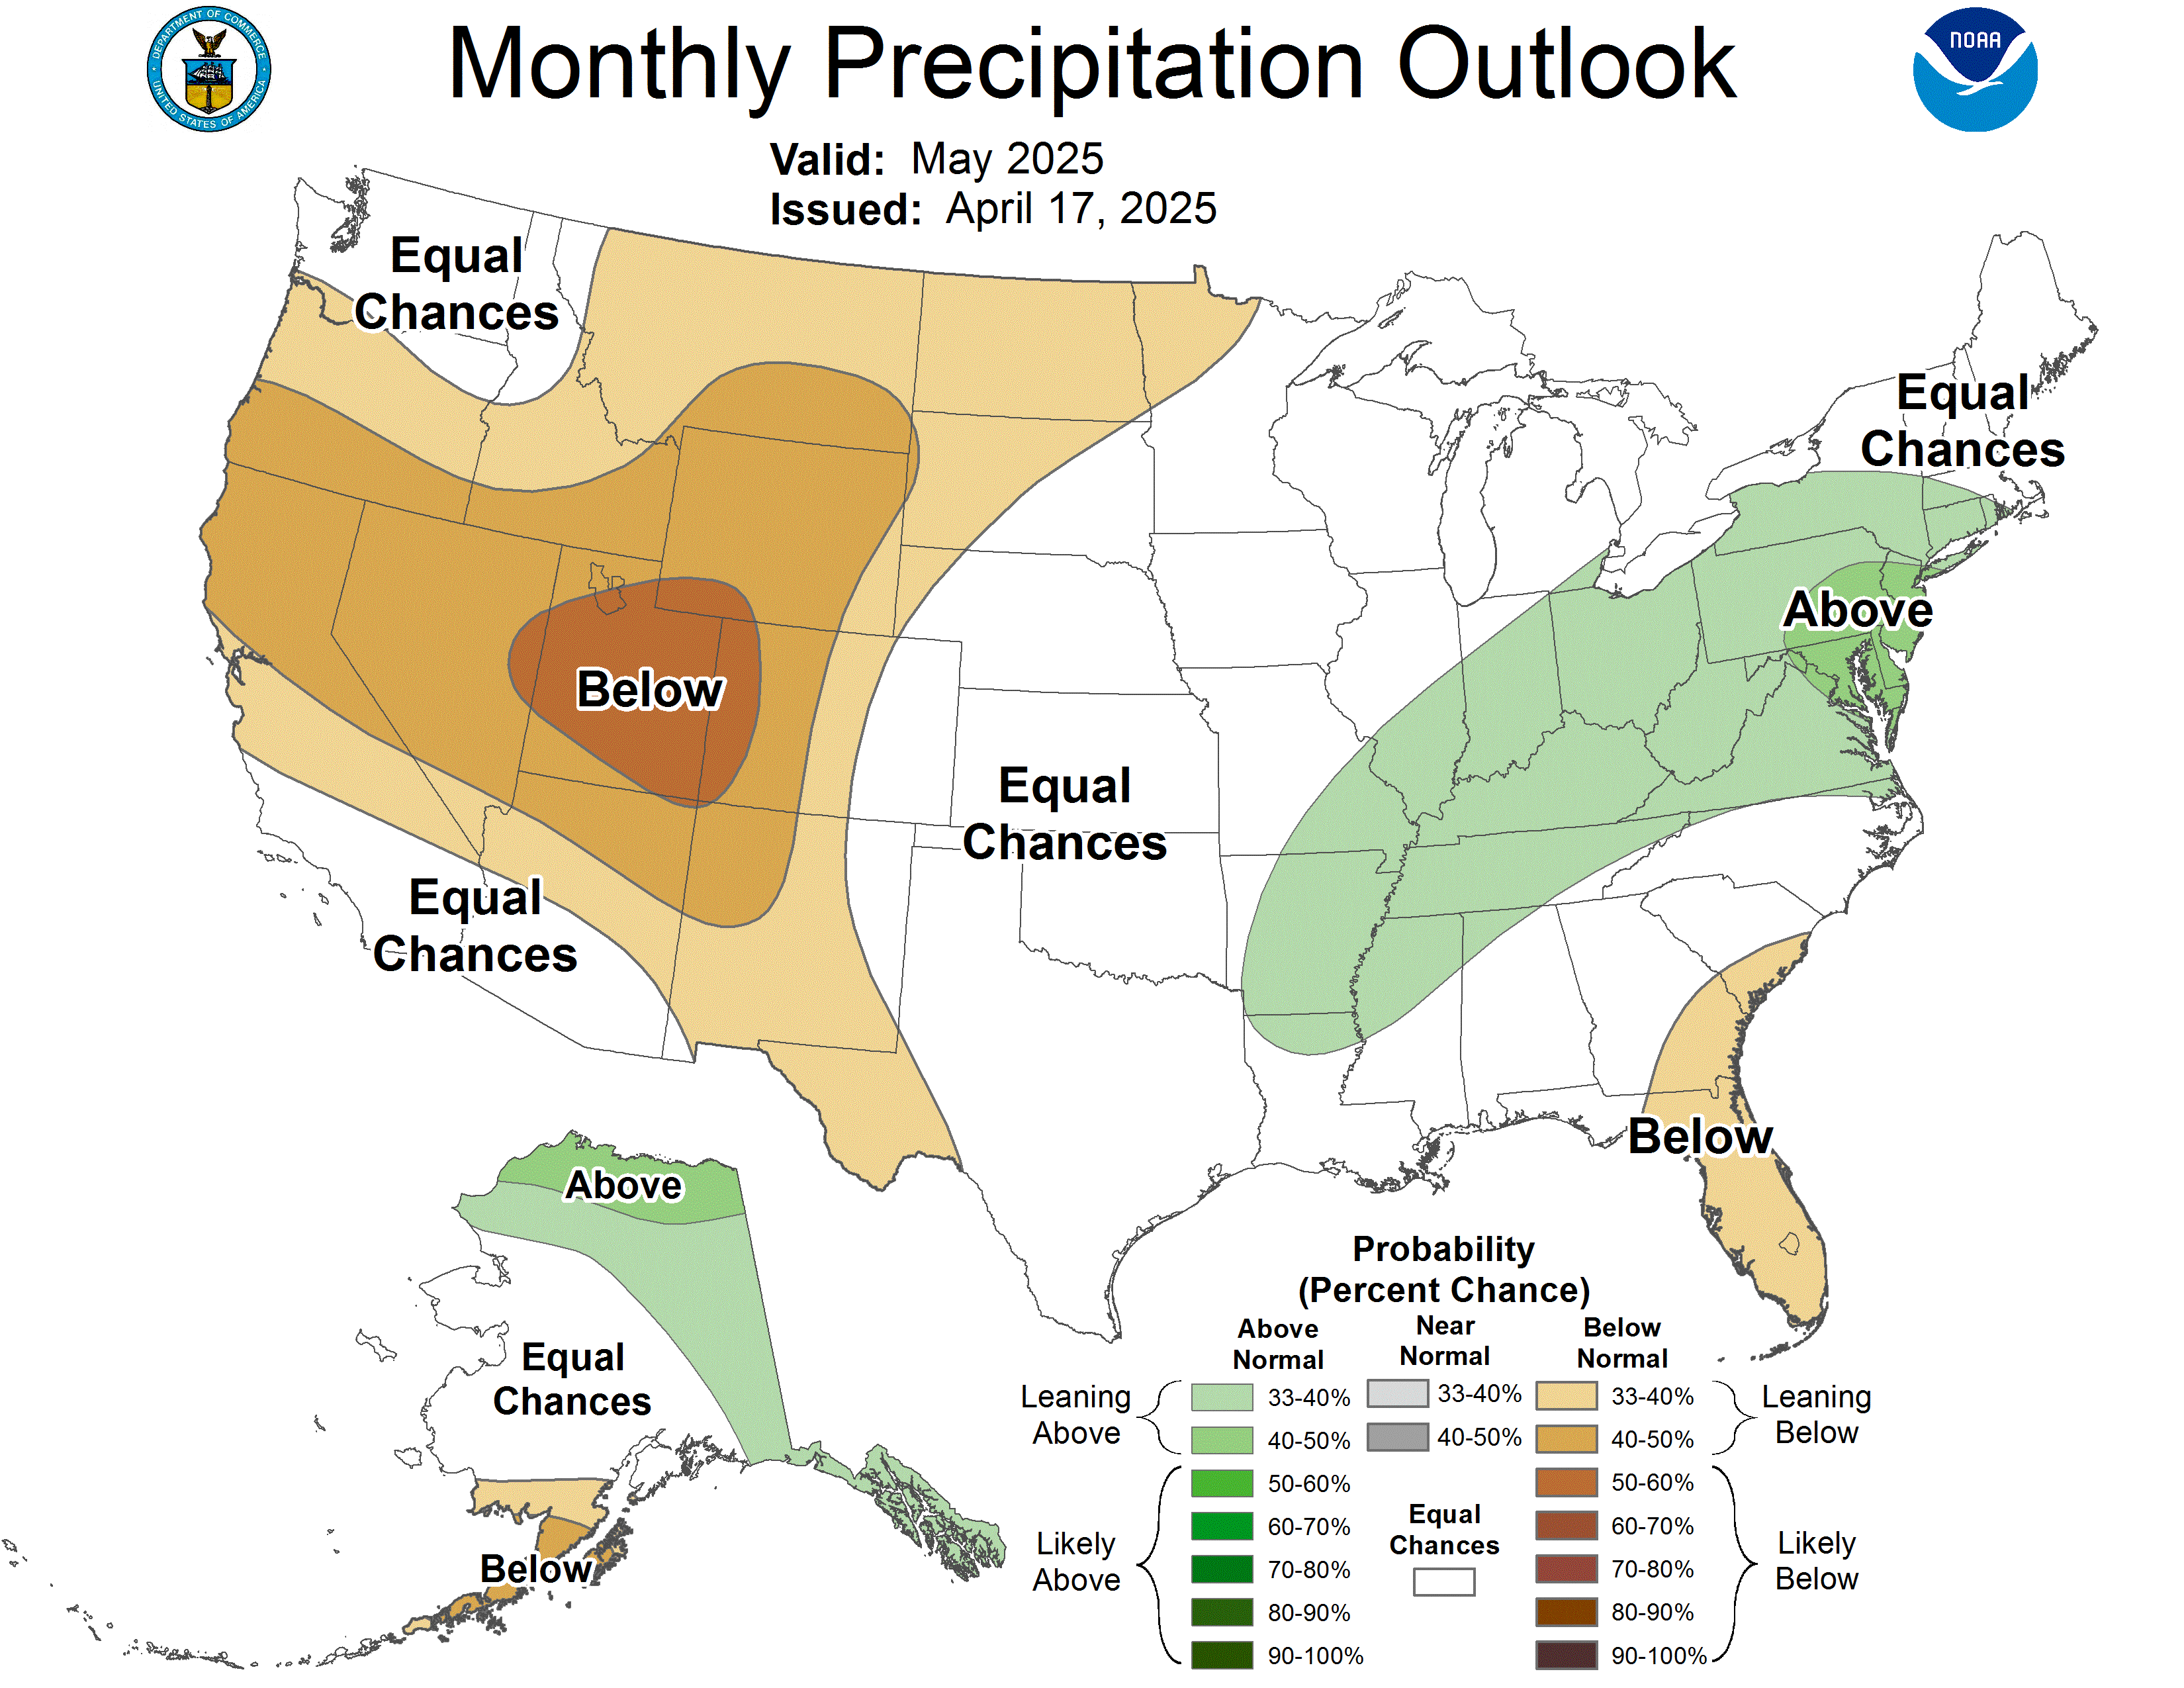
📅 Monthly Outlook (1-Month Lead)▼
Monthly Temperature
Monthly Precipitation
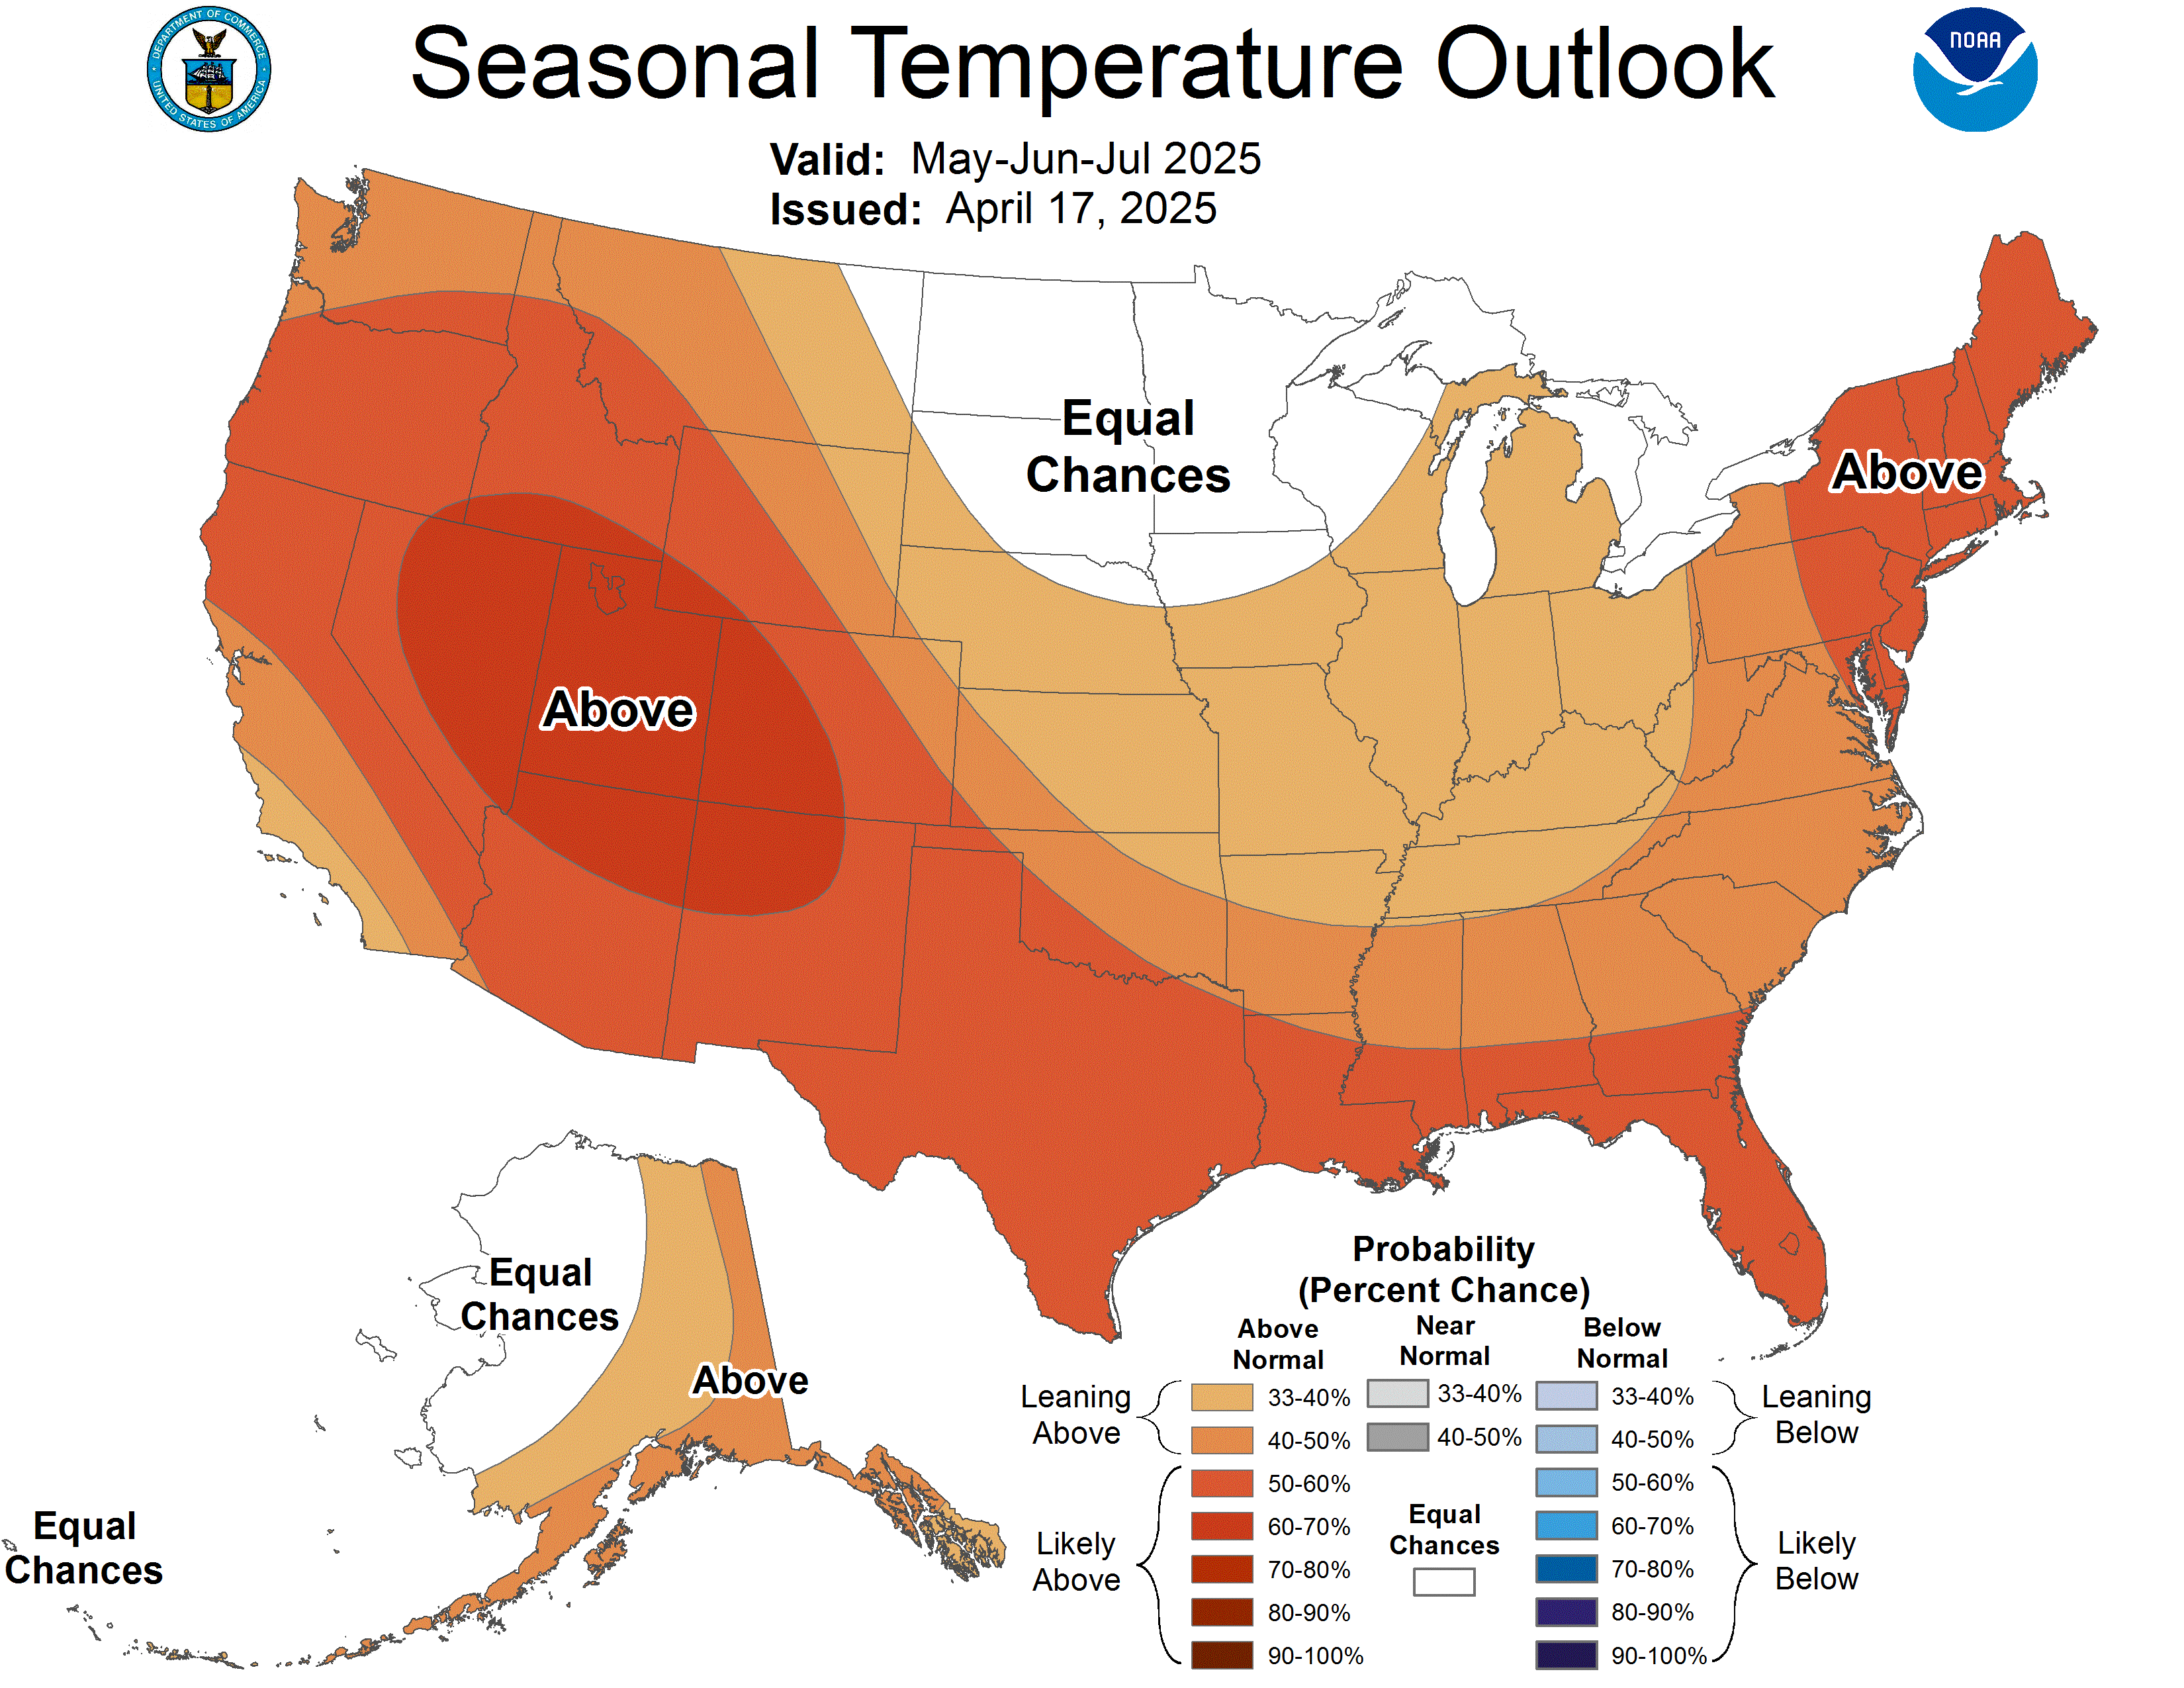
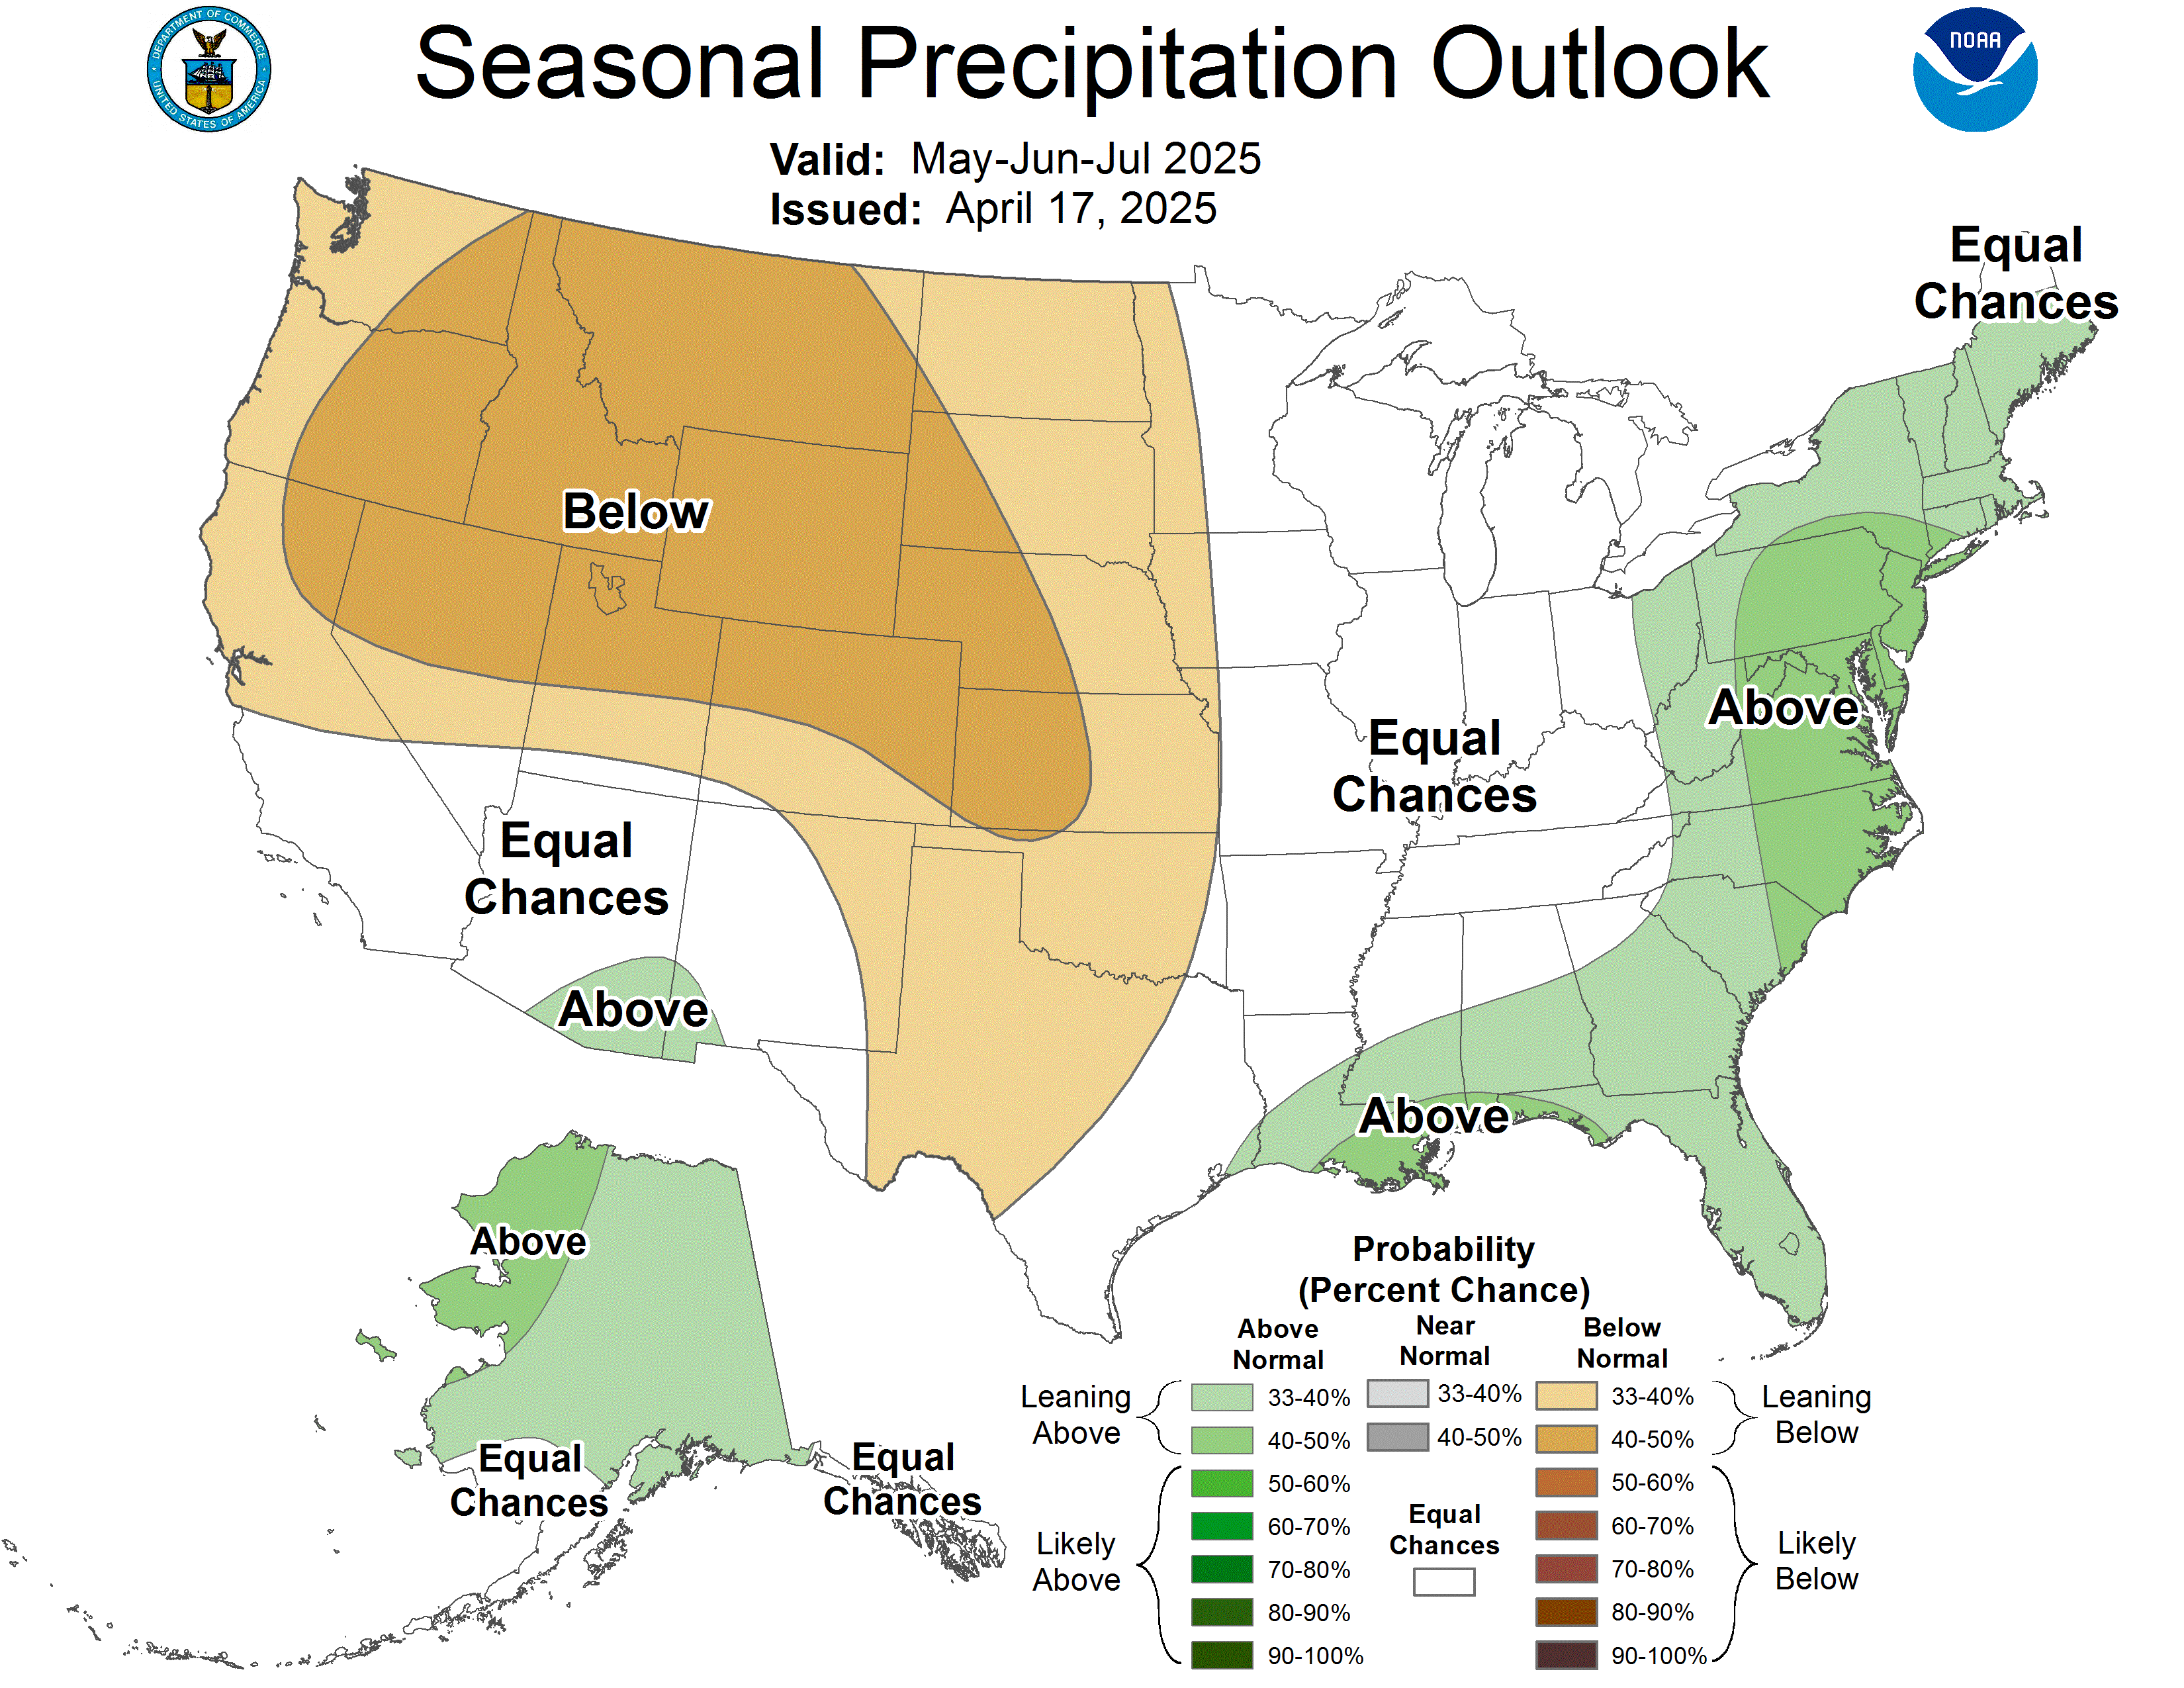
🌦 Seasonal Outlook (3-Month Lead)▼
Seasonal Temperature
Seasonal Precipitation
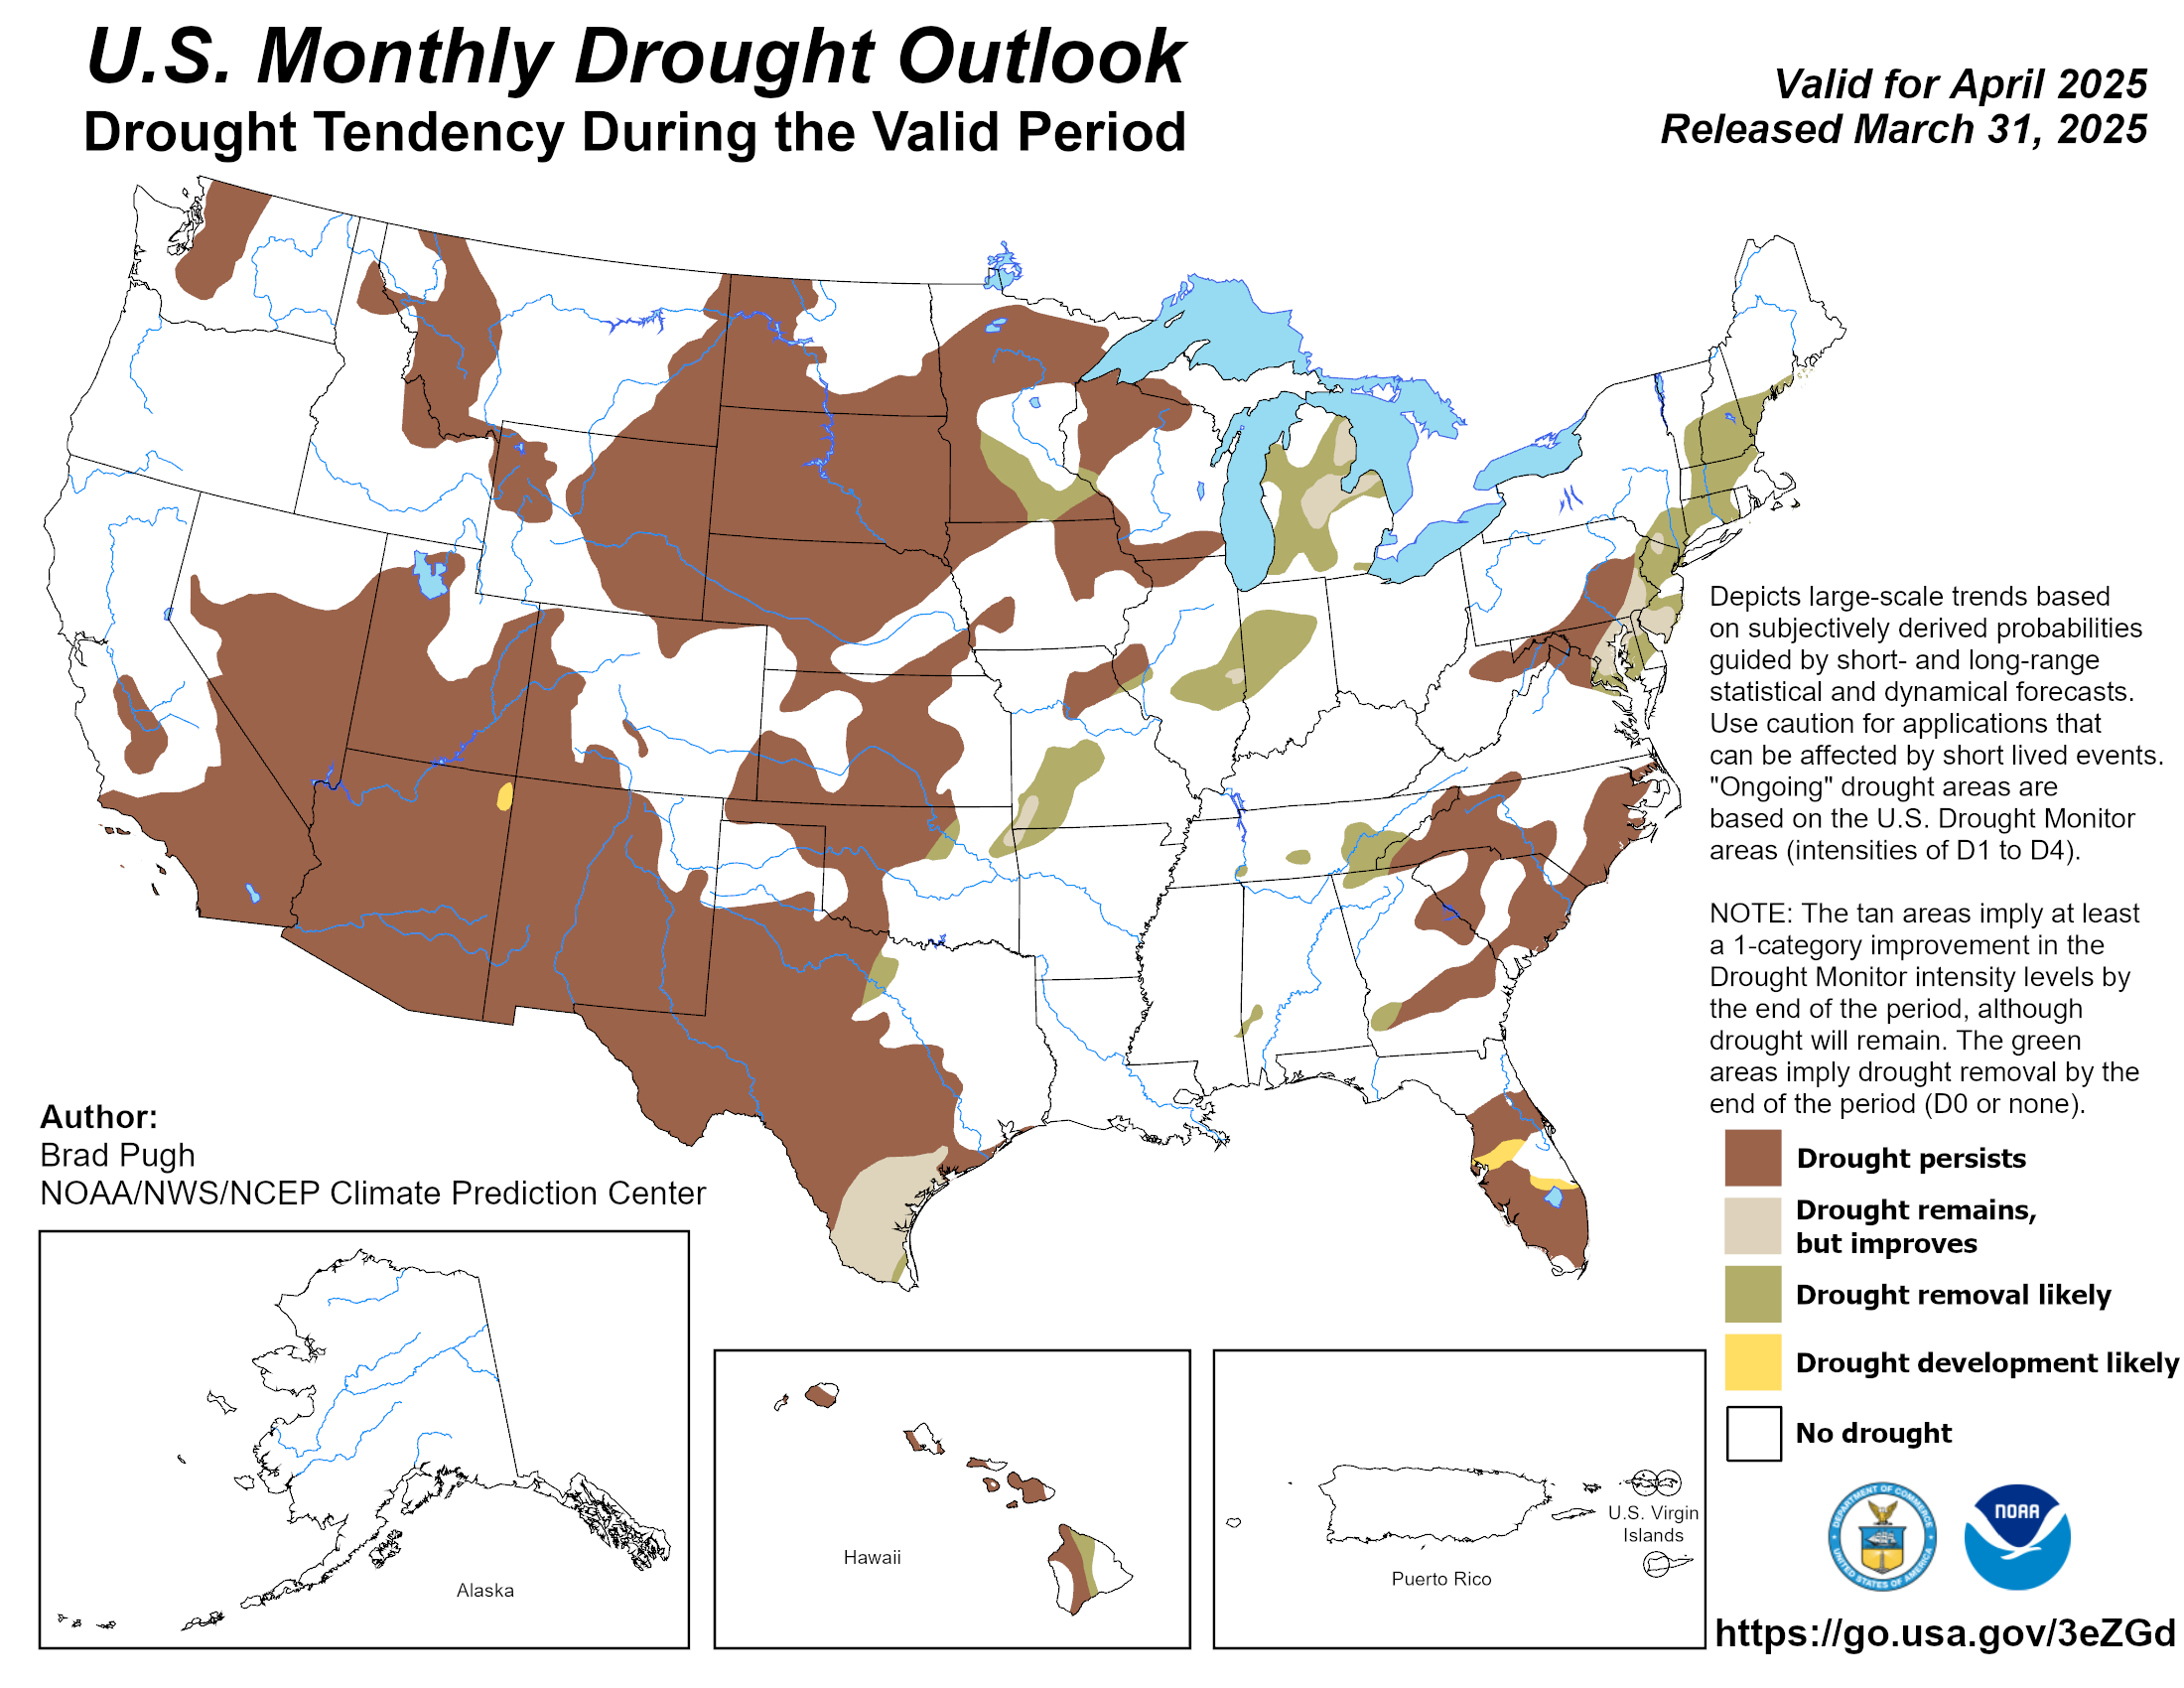
🌎 Drought Outlook▼
U.S. Drought Outlook
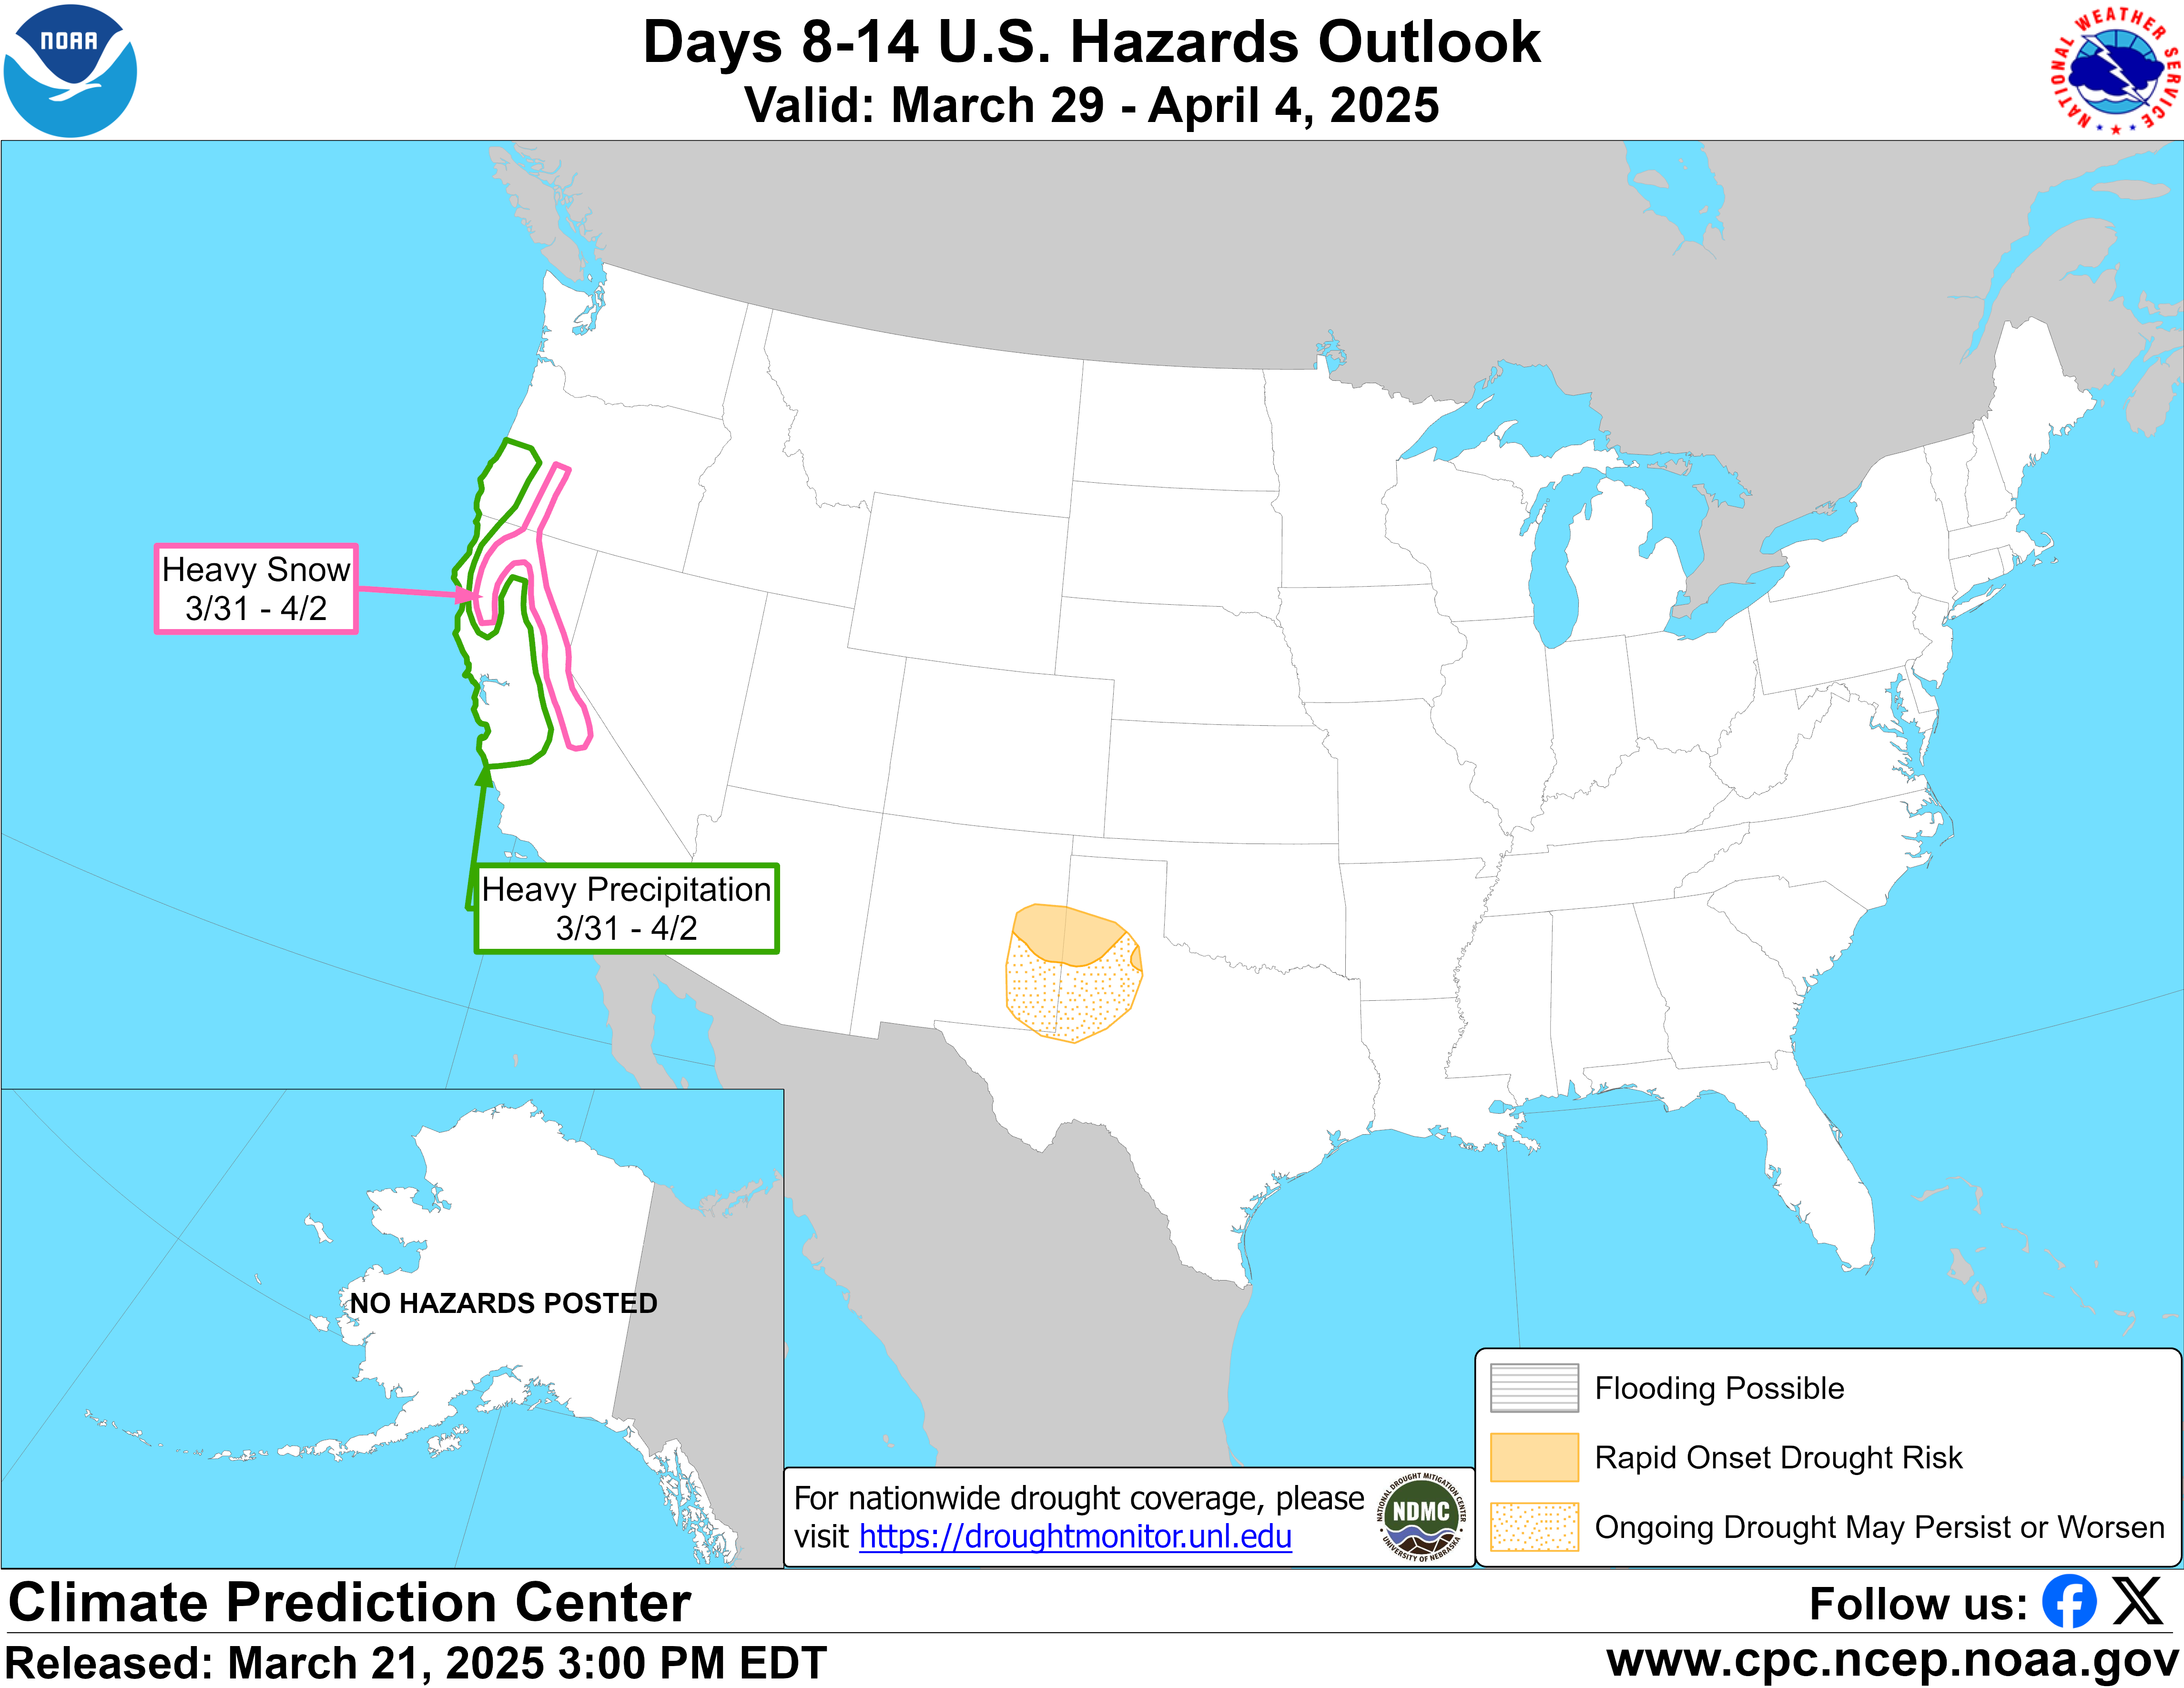
⚠ U.S. Hazards Outlook▼
U.S. Hazards Outlook
🌐 ADVANCED MODEL VIEWER
Professional forecast model maps — switch models, parameters, and time steps
Model
Parameter
Forecast Hour 0
Loading model data...
Run: --
Source: Tropical Tidbits — tropicaltidbits.com
Sierra Nevada Weather Maps & Radar
Live weather maps for Truckee, Lake Tahoe, and the Sierra Nevada including real-time Doppler radar, precipitation radar loop, wind speed and direction maps, temperature maps, cloud cover, thunderstorm tracking, snow depth, and GOES-18 satellite imagery. Our radar covers the Reno CWA (KRGX) with playable loops showing the last 3-6 hours of precipitation movement across I-80, Donner Pass, and the greater Tahoe Basin.
Available Weather Maps
Radar (live loop) · Rain accumulation · Wind speed & gusts · Temperature · Cloud cover · Thunder & lightning · Snow depth · GOES-18 visible satellite · Infrared satellite · Water vapor · Pacific overview · NOAA radar (Reno CWA) · RainViewer animated radar · SPC severe weather outlook · Jet stream · QPF precipitation forecast · CPC 6-10 day temperature outlook · CPC 8-14 day precipitation outlook · ECMWF model viewer · GFS model viewer
Advanced Forecast Models
Compare output from all 8 ensemble models — GFS, ECMWF, ICON, GEM (Canadian), JMA (Japan), UKMO (UK Met Office), CMA (China), and ECMWF-AI — across precip type, snow accumulation, temperature, wind, 500mb heights, jet stream, CAPE instability, total precipitation, and surface pressure. Step through individual forecast hours or animate the full run. Useful for tracking incoming Sierra storms 7-10 days out.
iPhone: Open in Safari → Tap ⬆️ Share → Scroll down → Add to Home Screen → Tap Add
Android: Tap ⋮ menu → Install App or Add to Home Screen → Tap Install
📈 Forecast Data — 16-Day Trends
🌡 Temperature Hi/Lo
💧 Precipitation Probability
💨 Wind Speed
⚡ CAPE Instability (J/kg)
💧 Relative Humidity
🌡 Dew Point
☁ Pressure (hPa)
❄ Snow Level (ft)
☀ UV Index
🌅 Daylight Hours
📊 Model Comparison — What Each Model Predicts
🌡 Model Hi Temp Spread
☁ Extended Forecast Data
☁ Cloud Cover %
Daily cloud cover — lower is clearer skies
🌡 Soil Temperature
Ground surface temp — frost/thaw indicator
💨 Precipitation Amount
Forecasted rain + snow in inches per day
❄ Daily Snowfall Forecast
Forecasted snow accumulation per day (inches)
🌀 Wind Direction
Dominant wind direction — compass bearing per day
👁 Visibility Forecast
Viewing distance in miles — fog and haze impact
📊 Model Deep Dive
🌡 Model Lo Temp Spread
What each model predicts for tomorrow's low
📈 Model Agreement Score
How much models agree — high = high confidence
📚 Historical Record — 20 Years of Sierra Weather
Deep historical analysis using Open-Meteo's archive. Seasonal snowfall, precipitation trends, temperature records, and growing season data for the Truckee/North Tahoe area.
❄ Seasonal Snowfall — 20 Winter Seasons
Total snowfall per winter season (Oct-Apr) in inches — current season highlighted
20-year average hi/lo by month vs current year overlay
🌡 Record Temperatures by Month
All-time record highs and lows for each month — 20 year range
❄ First & Last Snow Dates
When snow season started and ended each year
🌱 Growing Season Length
Days between last spring frost and first fall frost
🌎 Seasonal Outlook & Climate Signals
📚 Farmers' Almanac — Winter 2026-27 Outlook
🌧
Precipitation
Above Normal
🌡
Temperature
Below Normal
Sierra Nevada Forecast: The Farmers' Almanac predicts a cold, snowy winter for the Sierra Nevada region. Expect above-average snowfall with several major storm cycles, particularly in January and February. Temperatures are expected to run below normal through the core winter months, with a late-season storm potential extending into April. This pattern favors strong snowpack development — good news for California's water supply.
Source: Farmers' Almanac extended forecast outlook. Updated annually in August. Predictions are based on proprietary formula using sunspot activity, tidal action, and planetary positions.
🌎 El Nino / La Nina (ENSO) Status
🔥
EL NIÑO ADVISORY — ACTIVE
El Niño conditions PRESENT · SST anomaly +1.2°C and climbing
97%
Persists thru Spring '27
81%
Very Strong (Oct-Dec)
80%+
Super El Niño
What this means for the Sierra: NOAA has confirmed El Niño conditions are present with 97% chance of persistence through spring 2027. Models project SSTs reaching +3.0°C by September. The monster El Niños of 1982-83 and 1997-98 both delivered 600-800+ inch snowfall seasons at elevation. With an 81% chance of very strong status, expect above-average precipitation, extended atmospheric rivers, and potential for 400-600+ inches at Tahoe resorts. Full analysis on the blog.
Source: NOAA Climate Prediction Center El Niño Advisory · July 2026. Updated monthly.
🌦 CPC Seasonal Outlook — Sierra Nevada
Climate Prediction Center: The CPC's seasonal outlook for Northern California / Sierra Nevada has shifted dramatically. With El Niño conditions now confirmed and an 81% probability of a very strong event, the outlook favors above-normal precipitation for fall and winter 2026-27. SST anomalies at +1.2°C and climbing, with models projecting +3.0°C by September. This developing pattern historically delivers extended atmospheric river events and above-average snowfall to the Northern Sierra. The strongest El Niño on record may be forming.
Source: NOAA Climate Prediction Center El Niño Advisory & seasonal outlook maps · July 2026.
🌈 Atmospheric Analysis
💧 Precipitable Water
Total moisture in atmosphere column — atmospheric river indicator
🌙 Solar & Astronomical
🌙 Moon Phase
🌅 Sunrise & Sunset Times
Daily sunrise and sunset times showing the daylight curve
📈 Seismic Activity — 100mi Radius
🌏 Recent Earthquakes
USGS seismic events near Truckee — last 30 days
📡 Station Network Analysis
Real-time comparison of nearby NWS observation stations. See temperature, pressure, and wind patterns across the network — reveals elevation effects and approaching weather systems.
🌡 Station Temperature Comparison
Current temperature at all nearby stations — see elevation and microclimate effects
💧 Station Pressure Network
Barometric pressure at each station — gradients indicate weather fronts
💨 Station Wind Comparison
Wind speed and gusts across all stations — see where it's windiest
👁 Station Visibility
Visibility readings — low values mean fog, haze, or precipitation
🌡 Elevation vs Temperature
Scatter plot — temperature drops ~3.5°F per 1000ft of elevation gain (lapse rate)
📊 Ensemble Forecast Intelligence
Deep analysis of how our 8-model ensemble makes its predictions. See where models agree (high confidence) and where they diverge (uncertainty). This is the engine's brain.
🌡 Ensemble Temperature Spread
Shaded band showing min-to-max model range with ensemble average — wide band = uncertainty
⚡ Thunderstorm Probability
Model-voted thunderstorm probability per day — from weathercode voting + CAPE
❄ Snow Stick Probability
Will snow accumulate on the ground? Based on ground temp, air temp, and precipitation type
🌡 Freeze/Thaw Cycles
Days when temperature crosses 32°F — critical for construction, concrete curing, frost heave
iPhone: Open in Safari → Tap ⬆️ Share → Scroll down → Add to Home Screen → Tap Add
Android: Tap ⋮ menu → Install App or Add to Home Screen → Tap Install
📡 Weather Station Network
Real-time observations from nearby weather stations. Upstream stations (west) show what's heading your way. Downstream (east) show what's already passed. Weather flows west to east in the Sierra.
Real-time ground truth from weather stations expanding as you zoom out — 25 miles to 300 miles. Diamond pins are official NWS stations (KTRK, KBLU, KTVL, KRNO) with instrument-grade readings. Combined with radar to track storms approaching from 150+ miles away.
🌪
STORM APPROACHING
Radar loading...
Zoom level: 11 · Showing stations within 25 mi
Clear Cloudy/Wind Light Rain Heavy Rain Snow You NWS StationData: Open-Meteo + NWS + RainViewer
iPhone: Open in Safari → Tap ⬆️ Share → Scroll down → Add to Home Screen → Tap Add
Android: Tap ⋮ menu → Install App or Add to Home Screen → Tap Install
📊 Forecast Accuracy Dashboard
This platform self-corrects. Every forecast is logged and compared against what actually happened. The bias learning loop adjusts the ensemble blend to improve over time. No other consumer weather platform does this.
⚙
Loading accuracy data...
PRECIPITATION ACCURACY TRACKER
Forecasted precipitation probability vs what actually happened — the AGI feedback loop
Live ALERTCalifornia/ALERTWildfire cameras covering the Truckee-Tahoe region. These cameras are monitored 24/7 for smoke detection and early fire response.
📍 Tap a camera pin on the map to view its live feed. Use +/- to zoom into the Tahoe-Truckee area.
Data Sources: NWS alerts via api.weather.gov · Air quality via Open-Meteo · Fire data via NASA FIRMS · Earthquakes via USGS · Avalanche data via avalanche.org / Sierra Avalanche Center. All data is free, public, and updated automatically.
About This Platform
errolkerr.com/weather is a free weather intelligence platform for Truckee, California and the Sierra Nevada, built by Errol Kerr. It combines eight global forecast models — ECMWF, GFS, ICON, JMA, GEM, UKMO, CMA, and Meteo-France — into a single ensemble view with a 16-day extended forecast, real-time storm-cell tracking with approach ETAs, wildfire and smoke-direction alerts, 22 live Caltrans highway cameras along the I-80 corridor, upstream weather station data, USGS river streamflow readings, and 42+ interactive charts. The platform includes a self-learning back-checker that records forecast vs. actual conditions daily. Free forever, no signup required. Also see the GO/NO-GO crew weather decision tool and the storm forecast tracker.